
GNI Group (TSE:2160) Reported Wider Half Year Losses, Is The Discount Too Hard To Ignore?
GNI Group (TSE:2160) has drawn investor attention after reporting half year 2026 results, with sales of ¥11,937 million and a wider net loss of ¥1,988 million, alongside higher losses per share.
See our latest analysis for GNI Group.
Despite the wider loss in the latest half year, GNI Group’s share price return has been positive in recent months. The 30 day share price return is 16.97% and the year to date share price return is 24.63%, while the 5 year total shareholder return of 78.71% points to stronger long term results than the recent 1 year total shareholder return of 0.49%.
If GNI Group’s recent move has you reassessing opportunities in healthcare, it can be useful to compare it with other specialised players using a focused screener such as 7 healthcare AI stocks.
GNI Group trades at a sizeable discount to analyst targets and an estimated intrinsic value, even after the recent share price rebound. Is the market rightly wary of the wider losses, or mispricing the long term potential?
Preferred Price-to-Sales of 7.1x: Is It Justified?
On simple multiples, GNI Group looks mixed. The stock trades on a P/S ratio of 7.1x, which screens as expensive against its own fair ratio, yet cheaper than many biotech peers.
The P/S ratio compares the company’s market value with its revenue. For a business like GNI Group that is currently loss making, investors often look at P/S to gauge how much the market is paying for each unit of sales when profits are not yet in focus.
According to the SWS fair ratio model, a P/S of 3.6x would be more in line with GNI Group’s fundamentals. That suggests the current 7.1x multiple is rich compared with this fair value benchmark and could move closer to that level if sentiment or expectations change. At the same time, the stock trades on a lower P/S than both the peer average of 10x and the broader JP Biotechs industry average of 16.9x, which implies the market is still assigning a lower sales multiple to GNI Group than many biotech stocks in Japan.
Explore the SWS fair ratio for GNI Group
Result: Price-to-sales of 7.1x (OVERVALUED)
However, GNI Group still carries clear risks, including ongoing net losses of ¥5,484 million and reliance on clinical trial progress across multiple drug candidates as potential catalysts.
Find out about the key risks to this GNI Group narrative.
Another View on GNI Group Using the SWS DCF Model
The P/S discussion suggests GNI Group looks expensive relative to its fair ratio, yet cheaper than many peers. The SWS DCF model points in the opposite direction. At a share price of ¥2,854, the stock trades about 55.1% below an estimated future cash flow value of ¥6,357.16, which frames the current pricing as potentially undervalued instead of stretched. Which signal should be treated as more important?
Look into how the SWS DCF model arrives at its fair value.
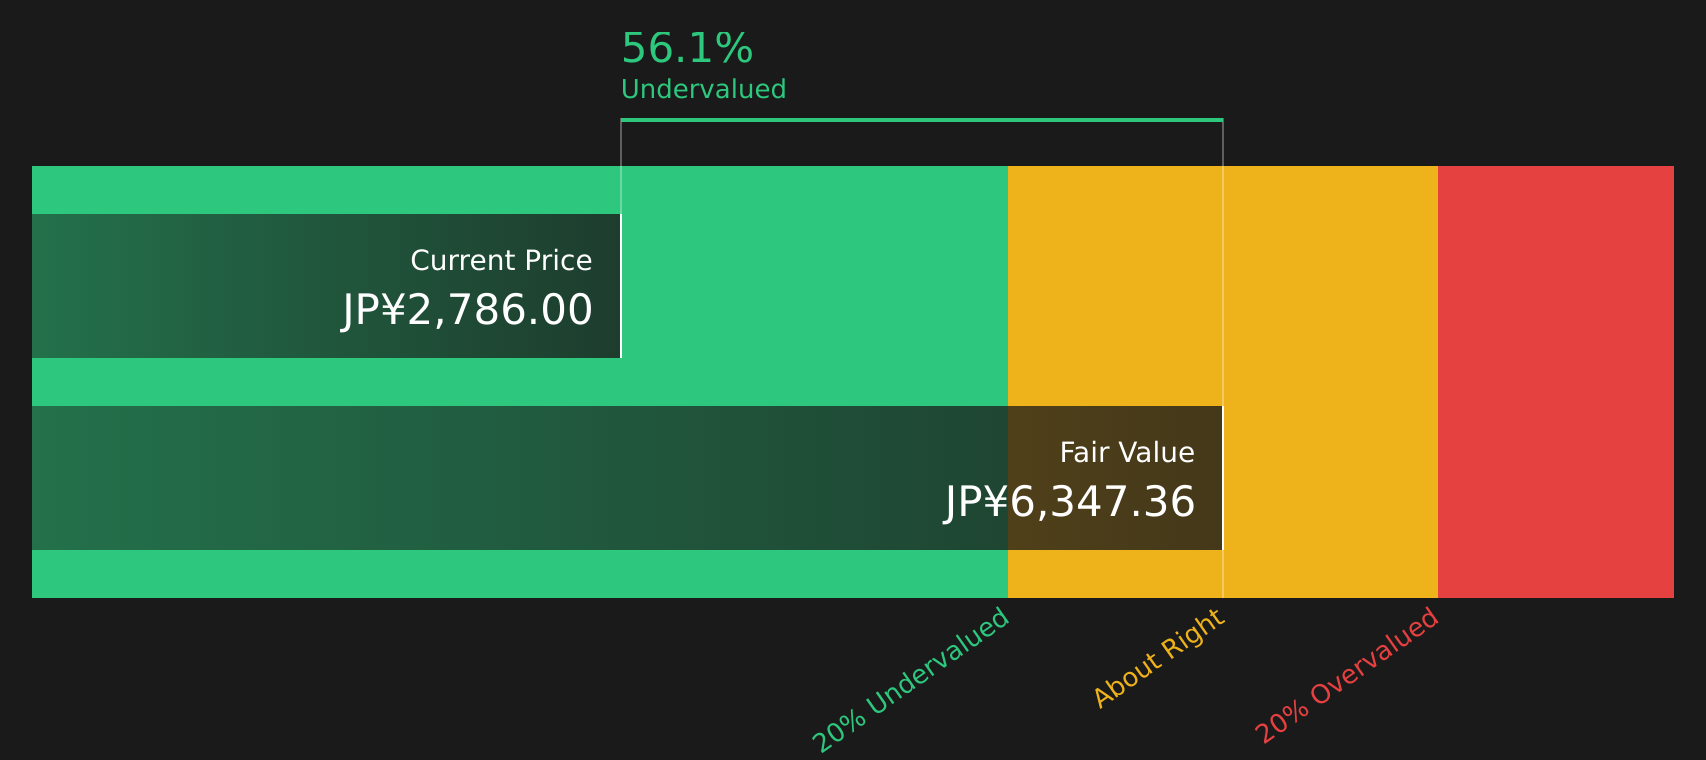
Simply Wall St performs a discounted cash flow (DCF) on every stock in the world every day (check out GNI Group for example). We show the entire calculation in full. You can track the result in your watchlist or portfolio and be alerted when this changes, or use our stock screener to discover 27 high quality undervalued stocks. If you save a screener we even alert you when new companies match - so you never miss a potential opportunity.
Next Steps
Given the mixed signals around GNI Group, it makes sense to look past the headlines and review the numbers yourself. If you want to weigh the concerns against the potential upsides, start by reviewing the 2 key rewards and 2 important warning signs.
Looking for more investment ideas beyond GNI Group?
If the mixed signals around GNI Group have you thinking more broadly about your portfolio, this is a good moment to scan for other opportunities before the market moves.
- Target potential value opportunities by reviewing companies highlighted in the 27 high quality undervalued stocks.
- Strengthen your income focus by checking out stocks featured in the 34 dividend fortresses.
- Aim for resilience by assessing companies surfaced through the 60 resilient stocks with low risk scores.
This article by Simply Wall St is general in nature. We provide commentary based on historical data and analyst forecasts only using an unbiased methodology and our articles are not intended to be financial advice. It does not constitute a recommendation to buy or sell any stock, and does not take account of your objectives, or your financial situation. We aim to bring you long-term focused analysis driven by fundamental data. Note that our analysis may not factor in the latest price-sensitive company announcements or qualitative material. Simply Wall St has no position in any stocks mentioned.
Have feedback on this article? Concerned about the content? Get in touch with us directly. Alternatively, email editorial-team@simplywallst.com