
European Value Stocks Trading Below Estimated Fair Value
As European markets navigate the complexities of geopolitical tensions and fluctuating energy prices, the pan-European STOXX Europe 600 Index has seen a slight decline, reflecting mixed investor sentiment. In this environment, identifying stocks that are trading below their estimated fair value can offer opportunities for investors seeking to capitalize on resilient regional economic data and solid corporate earnings.
Top 10 Undervalued Stocks Based On Cash Flows In Europe
| Name | Current Price | Fair Value (Est) | Discount (Est) |
| thyssenkrupp nucera KGaA (XTRA:NCH2) | €7.80 | €15.54 | 49.8% |
| Tecan Group (SWX:TECN) | CHF189.10 | CHF371.77 | 49.1% |
| Stille (OM:STIL) | SEK233.50 | SEK463.37 | 49.6% |
| Nemetschek (XTRA:NEM) | €62.45 | €123.43 | 49.4% |
| Mare Group (BIT:MARE) | €4.98 | €9.92 | 49.8% |
| F-Secure Oyj (HLSE:FSECURE) | €1.974 | €3.95 | 50% |
| DEUTZ (XTRA:DEZ) | €10.15 | €19.99 | 49.2% |
| Casta Diva Group (BIT:CDG) | €3.06 | €6.09 | 49.7% |
| Borregaard (OB:BRG) | NOK156.40 | NOK309.04 | 49.4% |
| Bonesupport Holding (OM:BONEX) | SEK223.60 | SEK442.17 | 49.4% |
We're going to check out a few of the best picks from our screener tool.
Tecan Group (SWX:TECN)
Overview: Tecan Group AG develops laboratory instruments and solutions for biopharmaceuticals, forensics, and clinical diagnostics across Europe, North America, Asia, and internationally, with a market cap of CHF2.33 billion.
Operations: The company's revenue is derived from its Partnering Business segment, which generated CHF500.66 million, and its Life Sciences Business segment, which contributed CHF378.25 million.
Estimated Discount To Fair Value: 49.1%
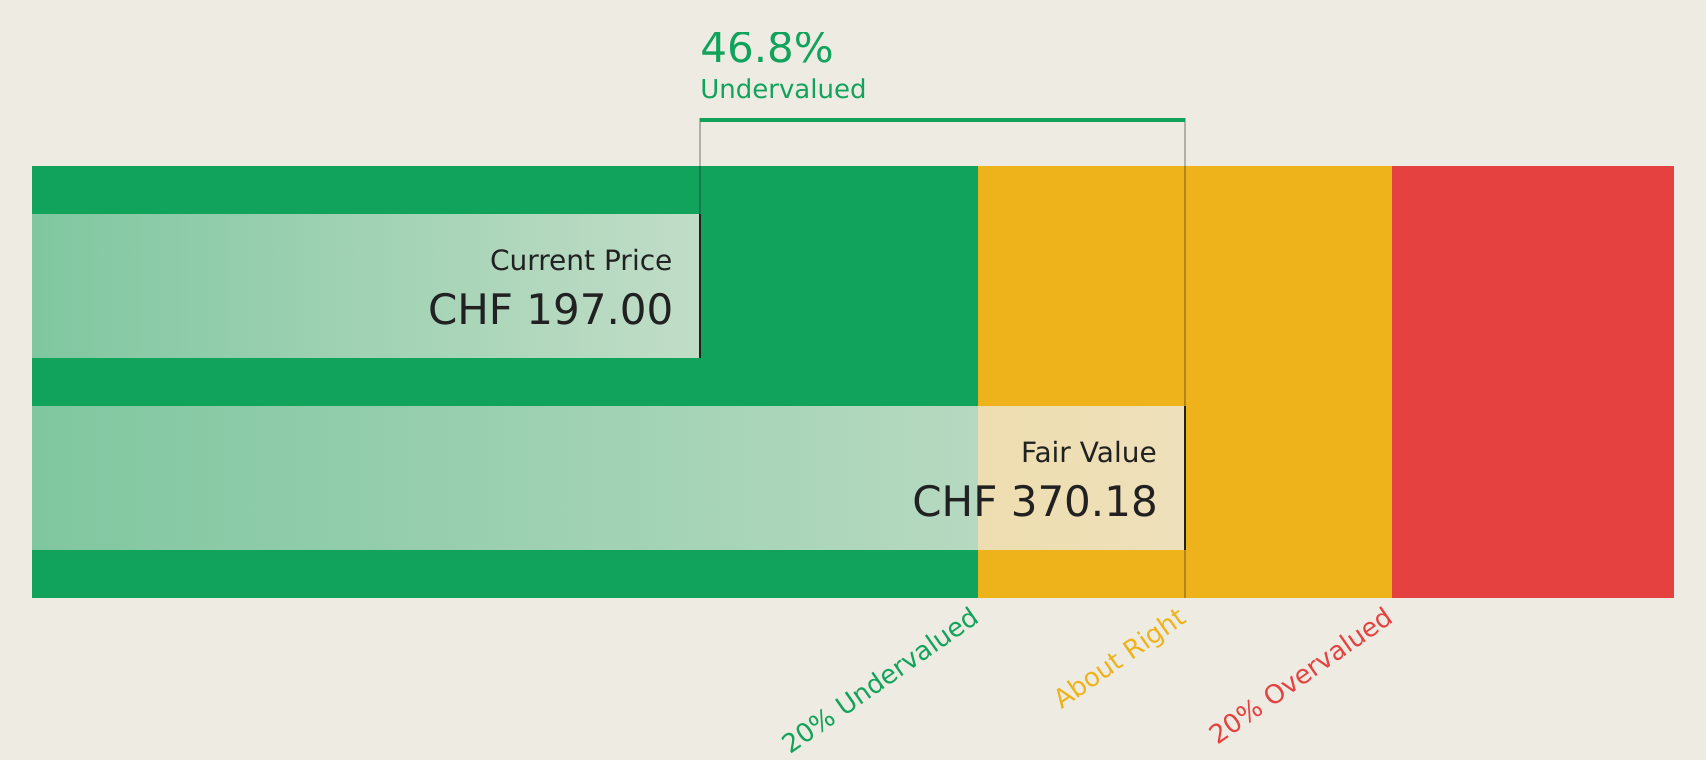
Tecan Group AG is trading at CHF 189.1, significantly below its estimated future cash flow value of CHF 371.77, indicating it is highly undervalued based on cash flows. Despite recent earnings showing a decline in sales and net income for H1 2026, the company forecasts revenue growth of 5.6% annually, outpacing the Swiss market's average. Tecan's expansion into high-growth markets like India supports its strategic positioning for future profitability and value realization.
- The growth report we've compiled suggests that Tecan Group's future prospects could be on the up.
- Navigate through the intricacies of Tecan Group with our comprehensive financial health report here.
Nordex (XTRA:NDX1)
Overview: Nordex SE, along with its subsidiaries, develops, manufactures, and distributes multi-megawatt onshore wind turbines across Europe, North America, Latin America, and other international markets, with a market cap of €9.33 billion.
Operations: The company generates revenue primarily from two segments: €7.16 billion from Projects and €900.69 million from Service.
Estimated Discount To Fair Value: 29.9%
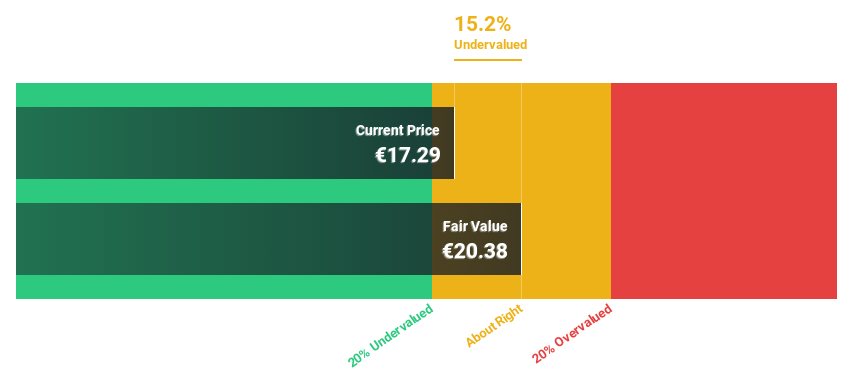
Nordex SE is trading at €39.46, significantly below its estimated future cash flow value of €56.31, highlighting its undervaluation based on cash flows. Earnings are forecast to grow 16.7% annually, surpassing the German market average. Recent orders in Türkiye and the U.S., totaling over 1 GW combined, bolster Nordex's growth prospects and operational footprint in key markets, while a new ESG-linked guarantee facility enhances financial flexibility with improved terms for future projects.
- Our expertly prepared growth report on Nordex implies its future financial outlook may be stronger than recent results.
- Dive into the specifics of Nordex here with our thorough financial health report.
Nemetschek (XTRA:NEM)
Overview: Nemetschek SE offers software solutions for the architecture, engineering, construction, operation, and media industries across Germany and globally, with a market cap of €7.21 billion.
Operations: The company's revenue segments are comprised of Build (€529.74 million), Media (€120.57 million), Design (€558.80 million), and Manage (€52.86 million).
Estimated Discount To Fair Value: 49.4%
Nemetschek SE, trading at €62.45, is undervalued based on cash flows with an estimated future cash flow value of €123.43. The company's earnings grew by 30.9% last year and are forecast to grow 17.1% annually, outpacing the German market average of 15.5%. Recent Q2 results show revenue increased to €332.12 million from €294.74 million a year ago, while net income rose to €66.04 million from €52.42 million, supporting its strong financial performance despite share price volatility.
- The analysis detailed in our Nemetschek growth report hints at robust future financial performance.
- Click here and access our complete balance sheet health report to understand the dynamics of Nemetschek.

Key Takeaways
- Click through to start exploring the rest of the 222 Undervalued European Stocks Based On Cash Flows now.
- Already own these companies? Link your portfolio to Simply Wall St and get alerts on any new warning signs to your stocks.
- Enhance your investing ability with the Simply Wall St app and enjoy free access to essential market intelligence spanning every continent.
Want To Explore Some Alternatives?
- Explore high-performing small cap companies that haven't yet garnered significant analyst attention.
- Diversify your portfolio with solid dividend payers offering reliable income streams to weather potential market turbulence.
- Fuel your portfolio with companies showing strong growth potential, backed by optimistic outlooks both from analysts and management.
This article by Simply Wall St is general in nature. We provide commentary based on historical data and analyst forecasts only using an unbiased methodology and our articles are not intended to be financial advice. It does not constitute a recommendation to buy or sell any stock, and does not take account of your objectives, or your financial situation. We aim to bring you long-term focused analysis driven by fundamental data. Note that our analysis may not factor in the latest price-sensitive company announcements or qualitative material. Simply Wall St has no position in any stocks mentioned.
Have feedback on this article? Concerned about the content? Get in touch with us directly. Alternatively, email editorial-team@simplywallst.com