
Is Narrowing Losses Reshaping The Cost Efficiency Story For Solaris Resources (TSX:SLS)?
- Solaris Resources Inc. reported past earnings results for the second quarter and six months ended June 30, 2026, with net loss falling to US$3.49 million for the quarter and US$8.45 million for the half-year, and basic loss per share from continuing operations easing to US$0.02 and US$0.05 respectively.
- This reduction in losses compared with the same periods a year earlier suggests the company’s cost structure or project spending profile has become more efficient.
- We’ll now examine how the reduction in net loss and loss per share shapes Solaris Resources’ investment narrative for investors.
Capitalize on the AI infrastructure supercycle with our selection of the 56 best 'picks and shovels' of the AI gold rush converting record-breaking demand into massive cash flow.
What Is Solaris Resources' Investment Narrative?
For Solaris Resources, the big-picture belief is that Warintza can be advanced from exploration towards development without overwhelming existing finances. The latest quarterly result, with a smaller net loss and lower loss per share, reinforces that story modestly by showing tighter cost control on a company that still has no revenue and negative equity. In the short term, the key catalysts remain permitting progress at Warintza, delivery of the next resource update and technical studies, and continued access to funding under the US$200 million Royal Gold package. The improved loss profile slightly eases near-term funding anxiety but does not remove it, especially after prior going-concern doubts and a relatively new management and board. Overall, the earnings news fits as a positive, but incremental, de-risking step.
However, funding the long path from exploration to potential production remains a key issue investors should understand. Our expertly prepared valuation report on Solaris Resources implies its share price may be too high.Exploring Other Perspectives
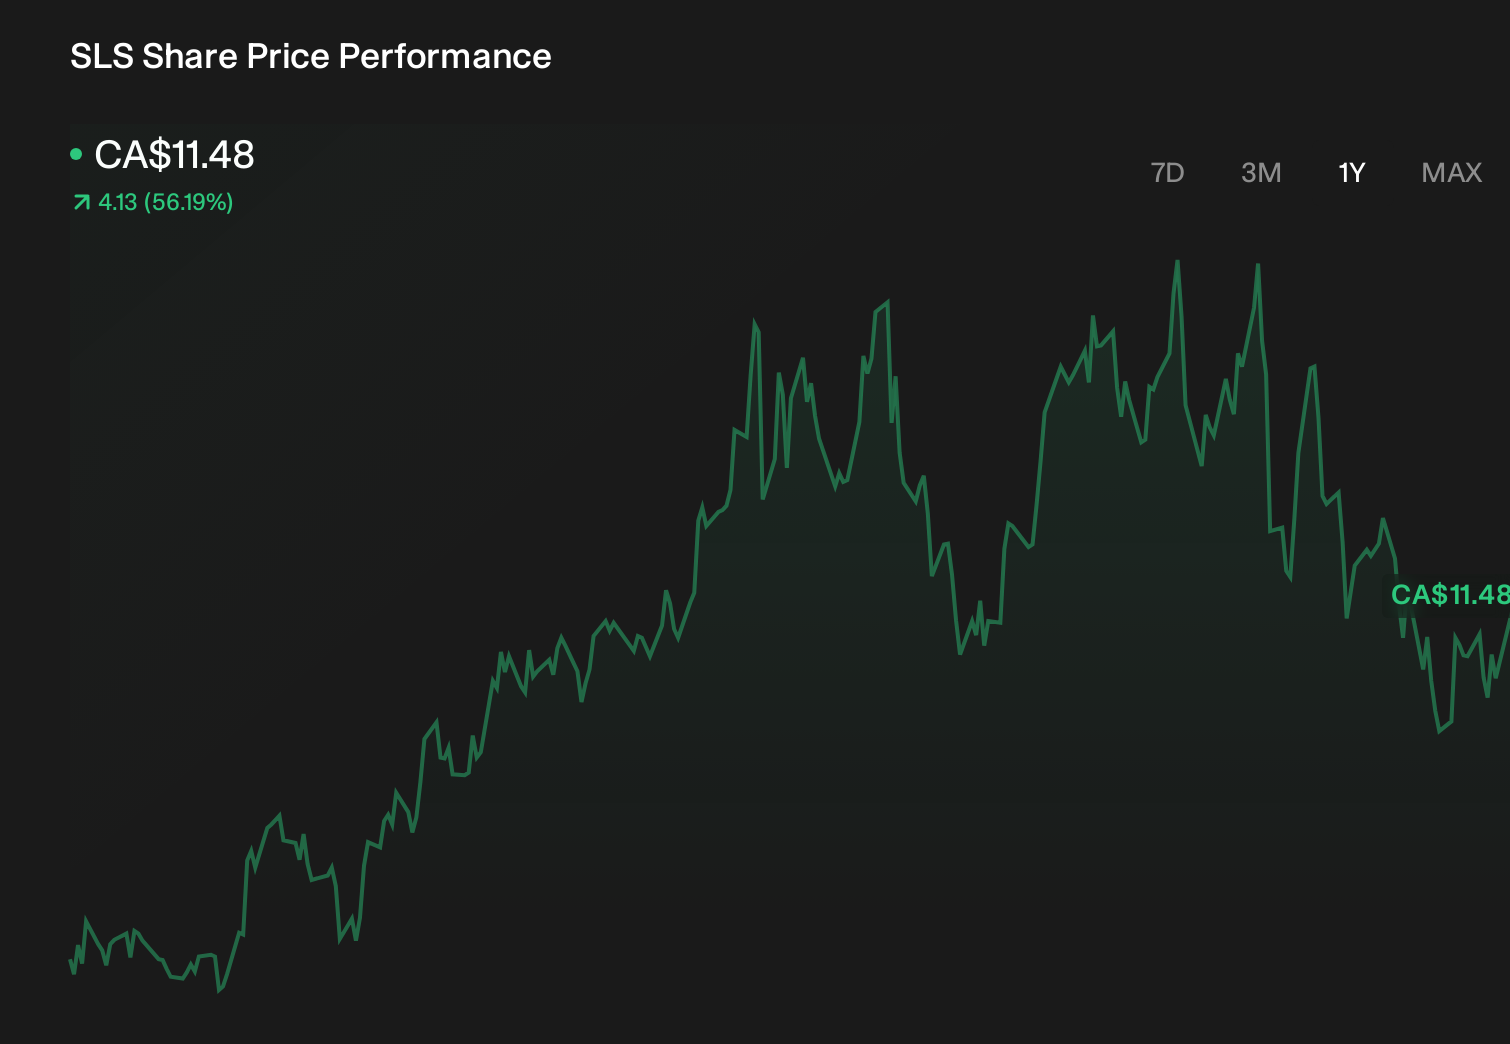
Explore another fair value estimate on Solaris Resources - why the stock might be worth just CA$21.30!
Form Your Own Verdict
Disagree with this assessment? Extraordinary investment returns rarely come from following the herd, so go with your instincts.
- A great starting point for your Solaris Resources research is our analysis highlighting 2 key rewards and 4 important warning signs that could impact your investment decision.
- Our free Solaris Resources research report provides a comprehensive fundamental analysis summarized in a single visual - the Snowflake - making it easy to evaluate Solaris Resources' overall financial health at a glance.
Searching For A Fresh Perspective?
Don't miss your shot at the next 10-bagger. Our latest stock picks just dropped:
- AI is about to change healthcare. These 7 stocks are working on everything from early diagnostics to drug discovery. The best part - they are all under $10b in market cap - there's still time to get in early.
- Find 11 companies with promising cash flow potential yet trading below their fair value.
- Rare earth metals are an input to most high-tech devices, military and defence systems and electric vehicles. The global race is on to secure supply of these critical minerals. Beat the pack to uncover the 28 best rare earth metal stocks of the very few that mine this essential strategic resource.
This article by Simply Wall St is general in nature. We provide commentary based on historical data and analyst forecasts only using an unbiased methodology and our articles are not intended to be financial advice. It does not constitute a recommendation to buy or sell any stock, and does not take account of your objectives, or your financial situation. We aim to bring you long-term focused analysis driven by fundamental data. Note that our analysis may not factor in the latest price-sensitive company announcements or qualitative material. Simply Wall St has no position in any stocks mentioned.
Have feedback on this article? Concerned about the content? Get in touch with us directly. Alternatively, email editorial-team@simplywallst.com