
KYB (TSE:7242) Heads Into Earnings Call As Investors Ask If It Still Looks Cheap
The upcoming Q1 2027 earnings call for KYB (TSE:7242) on 6 August 2026 has drawn fresh attention to the stock as investors look for clarity on recent returns and current valuation.
See our latest analysis for KYB.
KYB's share price has gained momentum in recent months, with a 30 day share price return of 10.25% and a 90 day share price return of 12.94%. The 1 year total shareholder return of 30.98% and 5 year total shareholder return of 288.38% highlight longer term compounding ahead of the upcoming earnings call.
If this kind of performance has you thinking about what else might be setting up for future growth, it could be a good time to scan 37 robotics and automation stocks
After a strong run in KYB's share price and multi year returns, the real tension now is whether most of the upside is already in the rearview mirror, or if the current valuation still leaves meaningful room ahead.
Preferred P/E of 7.7x for KYB: Is it justified?
On valuation, KYB is currently trading at ¥4,625 per share, which various checks label as good value relative to both its estimated fair value and peers when using a P/E lens.
The P/E multiple compares the current share price to earnings per share. For a company like KYB, which operates across automotive and hydraulic components, it gives a quick sense of how markets are pricing each unit of current earnings.
KYB is assessed as good value based on its P/E ratio of 7.7x compared to the peer average of 15x and the JP Auto Components industry average of 9.9x. It is also flagged as good value against an estimated fair P/E of 9.8x.
Explore the SWS fair ratio for KYB
Result: Price-to-earnings of 7.7x (UNDERVALUED)
However, there are still risks that could test the KYB story, including recently weaker net income growth and any setback related to the upcoming Q1 2027 earnings call.
Find out about the key risks to this KYB narrative.
Another view on KYB using the SWS DCF model
The P/E check suggests KYB looks inexpensive, and the SWS DCF model goes further by comparing the current share price of ¥4,625 with an estimated future cash flow value of ¥6,773.23. That comparison indicates KYB is trading at a 31.7% discount. Could this gap reflect risk, or a potential opportunity for patient investors?
Look into how the SWS DCF model arrives at its fair value.
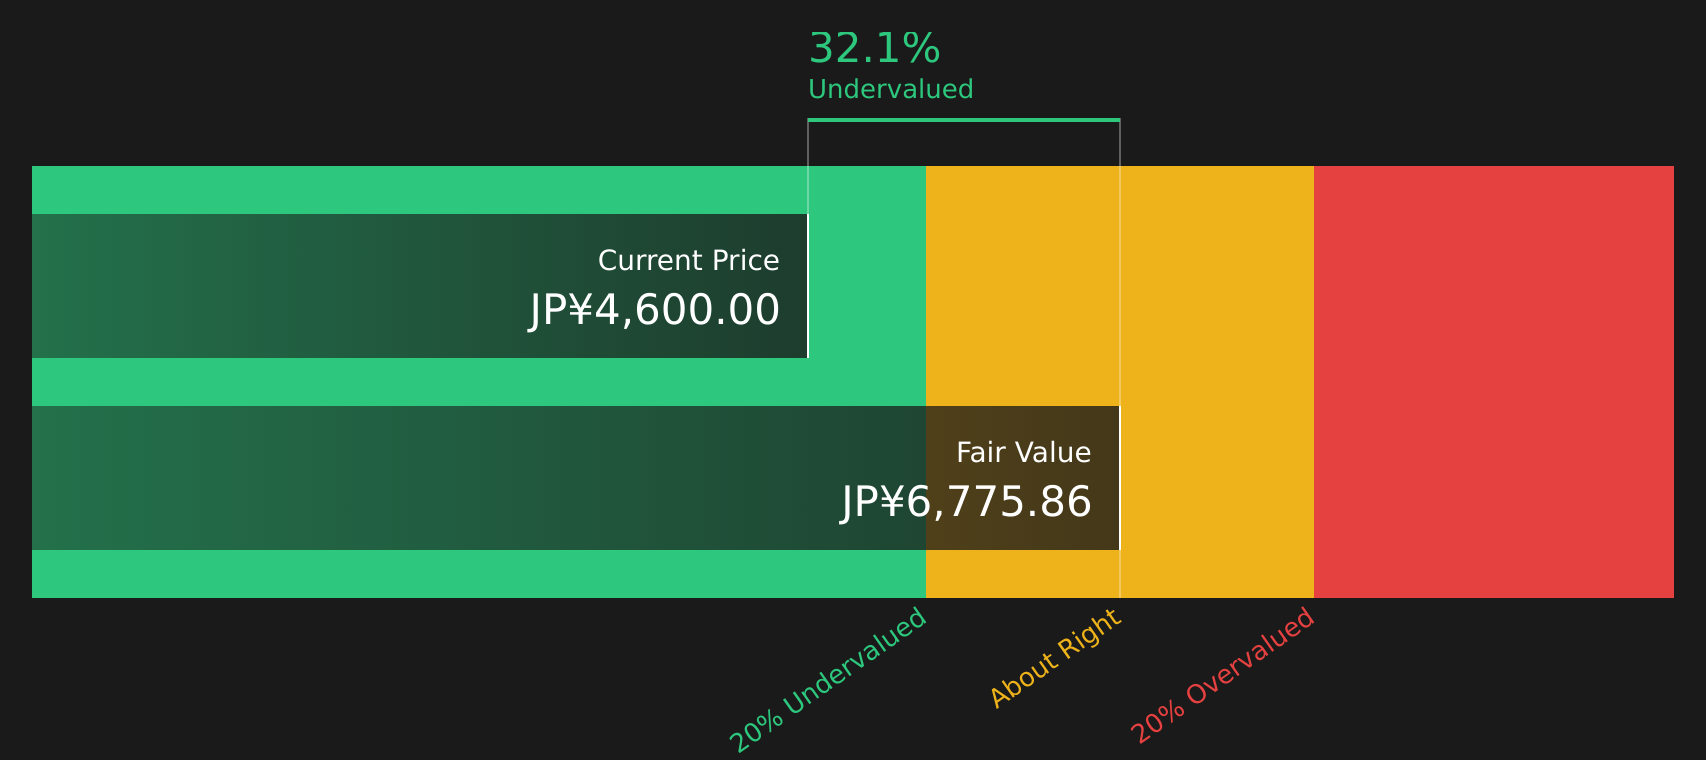
Simply Wall St performs a discounted cash flow (DCF) on every stock in the world every day (check out KYB for example). We show the entire calculation in full. You can track the result in your watchlist or portfolio and be alerted when this changes, or use our stock screener to discover 24 high quality undervalued stocks. If you save a screener we even alert you when new companies match - so you never miss a potential opportunity.
Next Steps
With KYB showing both potential and clear areas of concern, it makes sense to review the underlying data soon and decide where you stand. To weigh up both sides of the story in one place, start by checking the 2 key rewards and 2 important warning signs.
Looking for more investment ideas beyond KYB?
If you want a broader view than KYB alone, use the Simply Wall St Screener to spot stocks that match your own risk, income, and value preferences.
- Target potential mispricing by working through a focused set of 24 high quality undervalued stocks that combine fundamentals and price in one place.
- Build steadier income potential by checking 32 dividend fortresses that currently offer higher yields with supporting fundamentals.
- Prioritise capital protection by reviewing 59 resilient stocks with low risk scores that screen well on financial strength and business risk factors.
This article by Simply Wall St is general in nature. We provide commentary based on historical data and analyst forecasts only using an unbiased methodology and our articles are not intended to be financial advice. It does not constitute a recommendation to buy or sell any stock, and does not take account of your objectives, or your financial situation. We aim to bring you long-term focused analysis driven by fundamental data. Note that our analysis may not factor in the latest price-sensitive company announcements or qualitative material. Simply Wall St has no position in any stocks mentioned.
Have feedback on this article? Concerned about the content? Get in touch with us directly. Alternatively, email editorial-team@simplywallst.com