
Berkshire Hathaway (BRK.B), Why Is It Getting Attention Now?
Berkshire Hathaway (BRK.B) continues to attract attention as investors weigh its sprawling businesses in insurance, rail, utilities, manufacturing, and retail against recent share price moves and the company’s latest reported financial figures.
See our latest analysis for Berkshire Hathaway.
Recent trading has taken some heat out of Berkshire Hathaway’s momentum, with the share price down 3.41% over the past week. However, a 3.20% 90 day share price return and 5.62% one year total shareholder return still point to steadier longer term gains.
If this kind of broad, resilient business interests you, it could be a good time to widen your search and check out 21 top founder-led companies
Berkshire Hathaway’s mix of insurance, rail, energy, and consumer businesses gives it a broad earnings base. However, the share price has cooled slightly after a strong multi year run. Is this still a solid business at a fair price today?
Preferred P/E of 12.6x for Berkshire Hathaway: Is it justified?
Berkshire Hathaway is currently trading on a P/E of 12.6x, which its valuation checks flag as good value compared both to peers and the wider US diversified financials sector.
The P/E ratio compares the company’s share price with its earnings per share. For a group like Berkshire Hathaway that earns money across insurance, rail, energy and consumer businesses, the P/E helps you see how much investors are paying for each dollar of earnings across that mix.
Here, the stock’s 12.6x P/E is described as attractive versus the estimated fair P/E of 16.6x. That suggests the current pricing sits below a level the market could theoretically move toward if earnings quality and growth trends stay in line with those implied by that fair ratio.
The same 12.6x P/E is also assessed as low compared with the US diversified financial industry average of 18x and a peer average of 23.4x. That is a wide gap, and it supports the view that Berkshire Hathaway is trading at a discount to similar companies on this measure.
Explore the SWS fair ratio for Berkshire Hathaway
Result: Price-to-earnings of 12.6x (UNDERVALUED)
However, you still need to watch for pressure on Berkshire Hathaway’s earnings, given recent declines in net income growth and any shift in insurer or utility regulation.
Find out about the key risks to this Berkshire Hathaway narrative.
Another view on Berkshire Hathaway’s valuation
While Berkshire Hathaway looks inexpensive on a P/E of 12.6x, the SWS DCF model presents an even stronger value case. At a share price of $504.03 and an estimated future cash flow value of $785.81, the stock appears materially undervalued on this second approach.
This gap between cash flow value and current price raises a practical question for you: Is the market overestimating future earnings and return on equity headwinds, or is the DCF model too optimistic about Berkshire Hathaway’s long term cash generation potential?
Look into how the SWS DCF model arrives at its fair value.
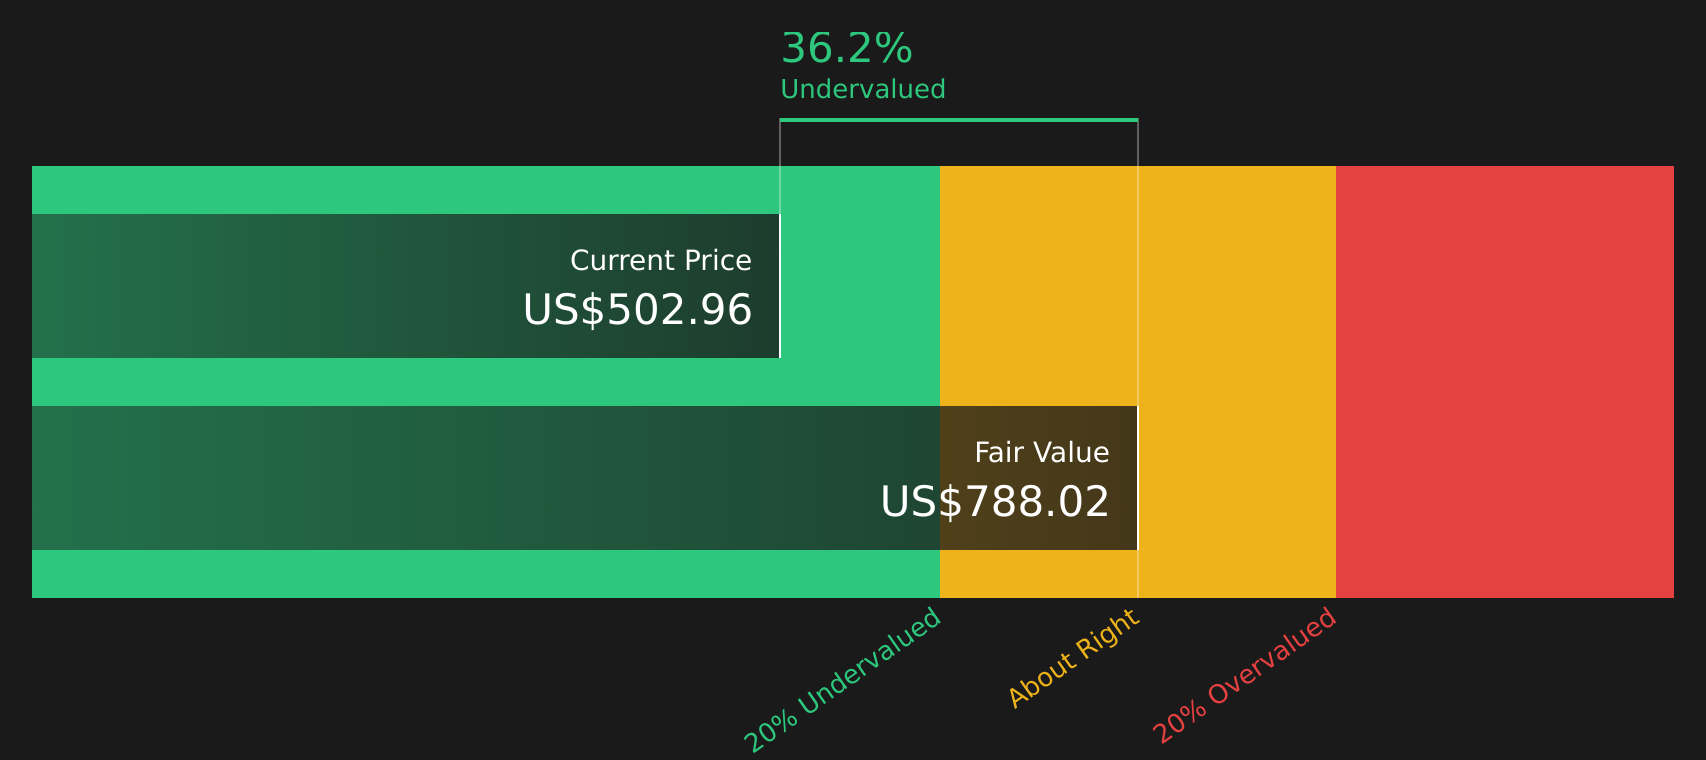
Simply Wall St performs a discounted cash flow (DCF) on every stock in the world every day (check out Berkshire Hathaway for example). We show the entire calculation in full. You can track the result in your watchlist or portfolio and be alerted when this changes, or use our stock screener to discover 52 high quality undervalued stocks. If you save a screener we even alert you when new companies match - so you never miss a potential opportunity.
Next Steps
If this mix of positives and concerns around Berkshire Hathaway leaves you with questions, look over the numbers yourself and make a call that fits your approach. To see how the balance of possible upsides and potential downsides stacks up in one place, check out the 3 key rewards and 1 important warning sign
Looking for more investment ideas beyond Berkshire Hathaway?
If Berkshire Hathaway’s set up has you thinking more broadly about your portfolio, use this momentum and scan for other opportunities that fit your style and risk comfort.
- Target potential mispricings by reviewing companies that screen as attractive on value and quality through the 52 high quality undervalued stocks
- Strengthen your income stream by reviewing companies that have been filtered for higher yields and robust payout profiles using the 10 dividend fortresses
- Dial back portfolio risk by focusing on companies filtered for balance sheet strength and resilient fundamentals through the solid balance sheet and fundamentals stocks screener (51 results)
This article by Simply Wall St is general in nature. We provide commentary based on historical data and analyst forecasts only using an unbiased methodology and our articles are not intended to be financial advice. It does not constitute a recommendation to buy or sell any stock, and does not take account of your objectives, or your financial situation. We aim to bring you long-term focused analysis driven by fundamental data. Note that our analysis may not factor in the latest price-sensitive company announcements or qualitative material. Simply Wall St has no position in any stocks mentioned.
Have feedback on this article? Concerned about the content? Get in touch with us directly. Alternatively, email editorial-team@simplywallst.com