
PropNex (SGX:OYY) Following Mixed Half Year 2026 Earnings Valuation Questions Return
Why PropNex Stock Is Back In Focus After Its Half Year 2026 Earnings
PropNex (SGX:OYY) is drawing investor attention after reporting half year 2026 results that showed revenue of S$603.02 million and net income of S$40.94 million, alongside slightly lower earnings per share.
See our latest analysis for PropNex.
At a share price of S$1.84, PropNex has seen a 2.22% 1 month share price return, while the year to date share price return is down 3.16% and the 5 year total shareholder return is 177.72%. This suggests that long term holders have experienced gains even as recent momentum has cooled.
If these earnings have you reassessing where opportunities might be, it can help to broaden your search and uncover 105 top founder-led companies
Recent earnings and the modest move in PropNex shares leave a clear gap between the current S$1.84 price and various fair value estimates. Where within that range does a reasonable valuation actually sit?
Price-to-Earnings of 19.7x: Is It Justified For PropNex?
On a P/E of 19.7x, PropNex trades richer than several key reference points. This suggests the current S$1.84 share price builds in a premium to peers.
The P/E ratio compares what you pay for each dollar of earnings. For a real estate services company like PropNex, it helps you see how the market prices its earnings against other listed property related businesses.
PropNex currently screens as expensive on multiple fronts. The P/E of 19.7x sits above the estimated fair P/E of 14.9x that the SWS fair ratio model points to as a level the valuation could move toward over time. It is also higher than the SG Real Estate industry average of 13.6x and a peer average of 12.3x. This indicates investors are paying a clear premium for the same unit of earnings compared to sector and peer benchmarks.
Explore the SWS fair ratio for PropNex
Result: Price-to-Earnings of 19.7x (OVERVALUED)
However, investors also need to weigh risks such as softer share price performance over the past year, as well as any shift in Singapore property transaction volumes that could pressure PropNex earnings.
Find out about the key risks to this PropNex narrative.
Another View On PropNex Using The SWS DCF Model
The P/E discussion portrays PropNex as expensive, yet the SWS DCF model suggests a different perspective. At S$1.84 the stock trades about 10.7% below an estimated fair value of S$2.06. This frames the same earnings stream as potentially undervalued instead.
This difference between a P/E of 19.7x and a discount to S$2.06 on the SWS DCF model raises a practical question for you. Which set of assumptions about future cash flows and risk appears closer to how PropNex actually operates, and which one do you rely on more when the signals disagree?
Look into how the SWS DCF model arrives at its fair value.
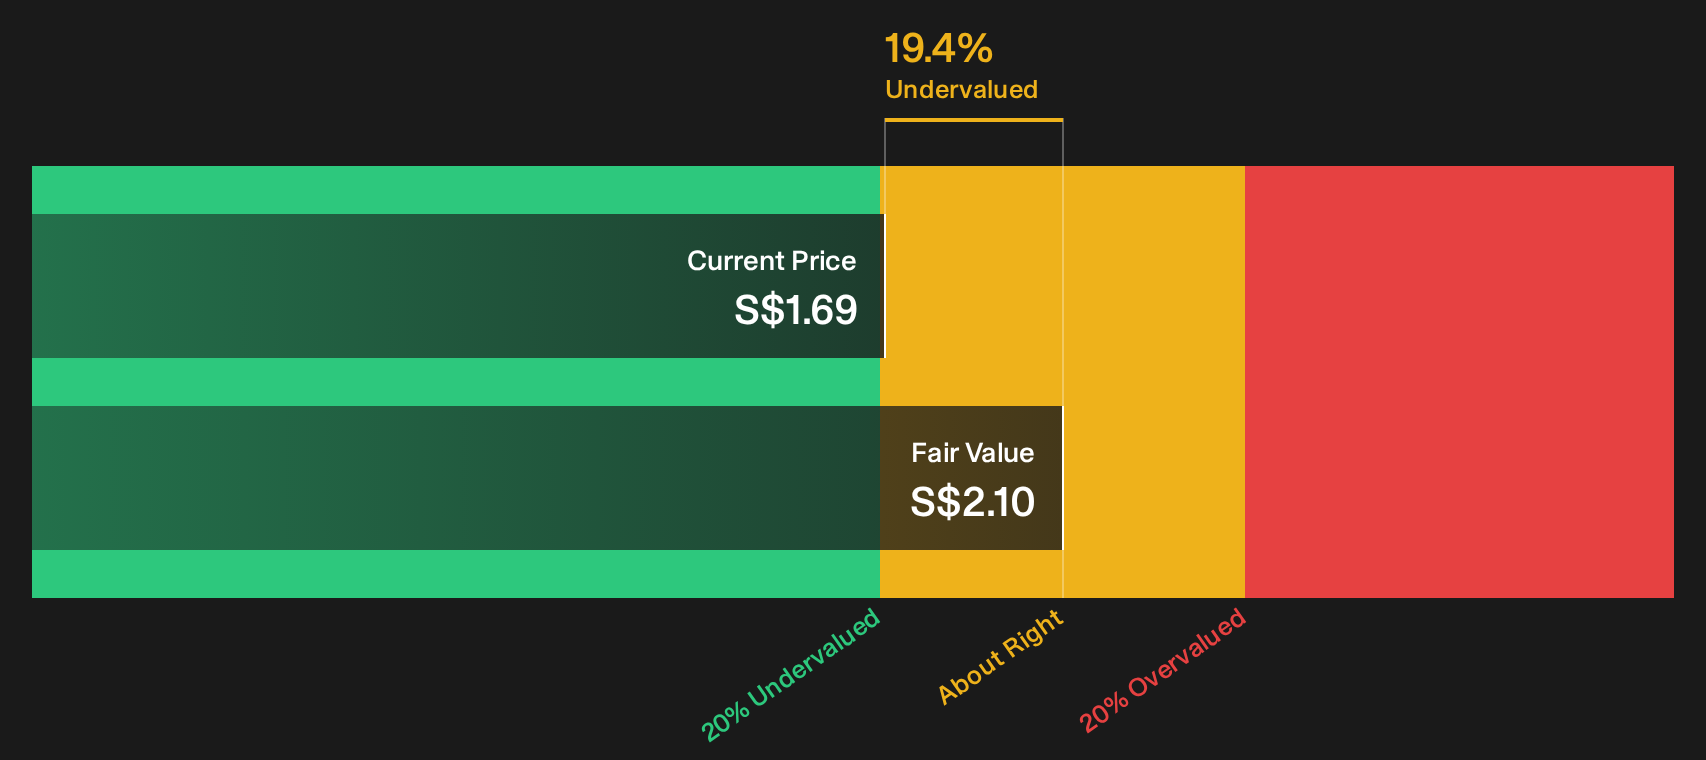
Simply Wall St performs a discounted cash flow (DCF) on every stock in the world every day (check out PropNex for example). We show the entire calculation in full. You can track the result in your watchlist or portfolio and be alerted when this changes, or use our stock screener to discover 256 high quality undervalued stocks. If you save a screener we even alert you when new companies match - so you never miss a potential opportunity.
Next Steps
With mixed signals on PropNex from P/E and DCF, it makes sense to move quickly, review the full picture, and weigh both concerns and potential upsides. You can see how the trade off between these factors looks in practice by checking the 3 key rewards and 1 important warning sign
Looking For More Investment Ideas Beyond PropNex?
If PropNex has sharpened your focus on valuation and quality, do not stop here. The right screener can surface ideas you would otherwise miss.
- Spot potential bargains early by scanning 256 high quality undervalued stocks that combine solid fundamentals with room for re rating.
- Strengthen your portfolio’s resilience by filtering for 300 resilient stocks with low risk scores that score well on stability and financial health.
- Unearth underfollowed opportunities before the crowd by running the screener containing 616 high quality undiscovered gems.
This article by Simply Wall St is general in nature. We provide commentary based on historical data and analyst forecasts only using an unbiased methodology and our articles are not intended to be financial advice. It does not constitute a recommendation to buy or sell any stock, and does not take account of your objectives, or your financial situation. We aim to bring you long-term focused analysis driven by fundamental data. Note that our analysis may not factor in the latest price-sensitive company announcements or qualitative material. Simply Wall St has no position in any stocks mentioned.
Have feedback on this article? Concerned about the content? Get in touch with us directly. Alternatively, email editorial-team@simplywallst.com