
Toyo Seikan Group Holdings (TSE:5901) Lifts Guidance And Starts Buyback As Valuation Questions Linger
Toyo Seikan Group Holdings (TSE:5901) has put investor attention squarely on its stock after announcing a share repurchase program, along with revised earnings guidance covering the current half year and full fiscal year.
See our latest analysis for Toyo Seikan Group Holdings.
The revised guidance and buyback announcement come after a steady run in Toyo Seikan Group Holdings' shares, with a 30 day share price return of 9.73% and a 90 day share price return of 19.24%, while the 5 year total shareholder return of 267.72% suggests long term momentum has been strong.
If this kind of renewed interest in Toyo Seikan Group Holdings has you looking beyond a single stock, it can be useful to see what else is on the move and uncover 11 top founder-led companies
For Toyo Seikan Group Holdings, the recent jump follows upgraded forecasts and a sizeable buyback plan that both speak to business performance and capital allocation. Is the share price now ahead of fundamentals or still playing catch up?
Preferred P/E of 12.4x for Toyo Seikan Group Holdings: Is it justified?
Toyo Seikan Group Holdings last closed at ¥4,419 and is trading on a P/E of 12.4x, which sits above both its industry and peer averages.
The P/E multiple compares the current share price to earnings per share and is a quick way to see what investors are paying for ¥1 of earnings. For a packaging company like Toyo Seikan Group Holdings, it often reflects expectations around profit durability, pricing power and how efficiently those earnings are generated.
On one hand, the company has delivered 95% earnings growth over the past year, with profit margins at 5.4% compared with 3% a year earlier, and earnings growing by 8.3% per year over the past 5 years. That track record can help explain why the market is willing to pay a higher multiple, even though Return on Equity sits at a relatively low 7.5%.
However, the current P/E of 12.4x is described as expensive compared with both the JP Packaging industry average of 9.2x and the peer average of 10.3x. That signals that investors are assigning Toyo Seikan Group Holdings a premium to its immediate competition and to the wider group of similar companies. This leaves less room for disappointment if future earnings do not keep pace with what is implied by this higher multiple.
5901 is also trading at ¥4,419 compared with an SWS DCF model estimate of future cash flow value of ¥7,425.85, which suggests the market price is 40.5% below that estimate of fair value. This gap between a relatively expensive P/E against peers and a discount to the DCF estimate highlights how different valuation methods can paint contrasting pictures of Toyo Seikan Group Holdings at the moment.
See what the numbers say about this price — find out in our valuation breakdown.
Result: Preferred multiple of Price-to-Earnings of 12.4x (OVERVALUED)
However, Toyo Seikan Group Holdings still faces the risk that earnings may miss current expectations or that the buyback pace may slow and cool sentiment.
Find out about the key risks to this Toyo Seikan Group Holdings narrative.
Another view on Toyo Seikan Group Holdings' value
The P/E of 12.4x makes Toyo Seikan Group Holdings look expensive compared with the JP Packaging industry on 9.2x and peers on 10.3x. Yet the SWS DCF model points to a fair value of ¥7,425.85 per share, which is 40.5% above the current ¥4,419 price. Which signal do you pay more attention to?
Look into how the SWS DCF model arrives at its fair value.
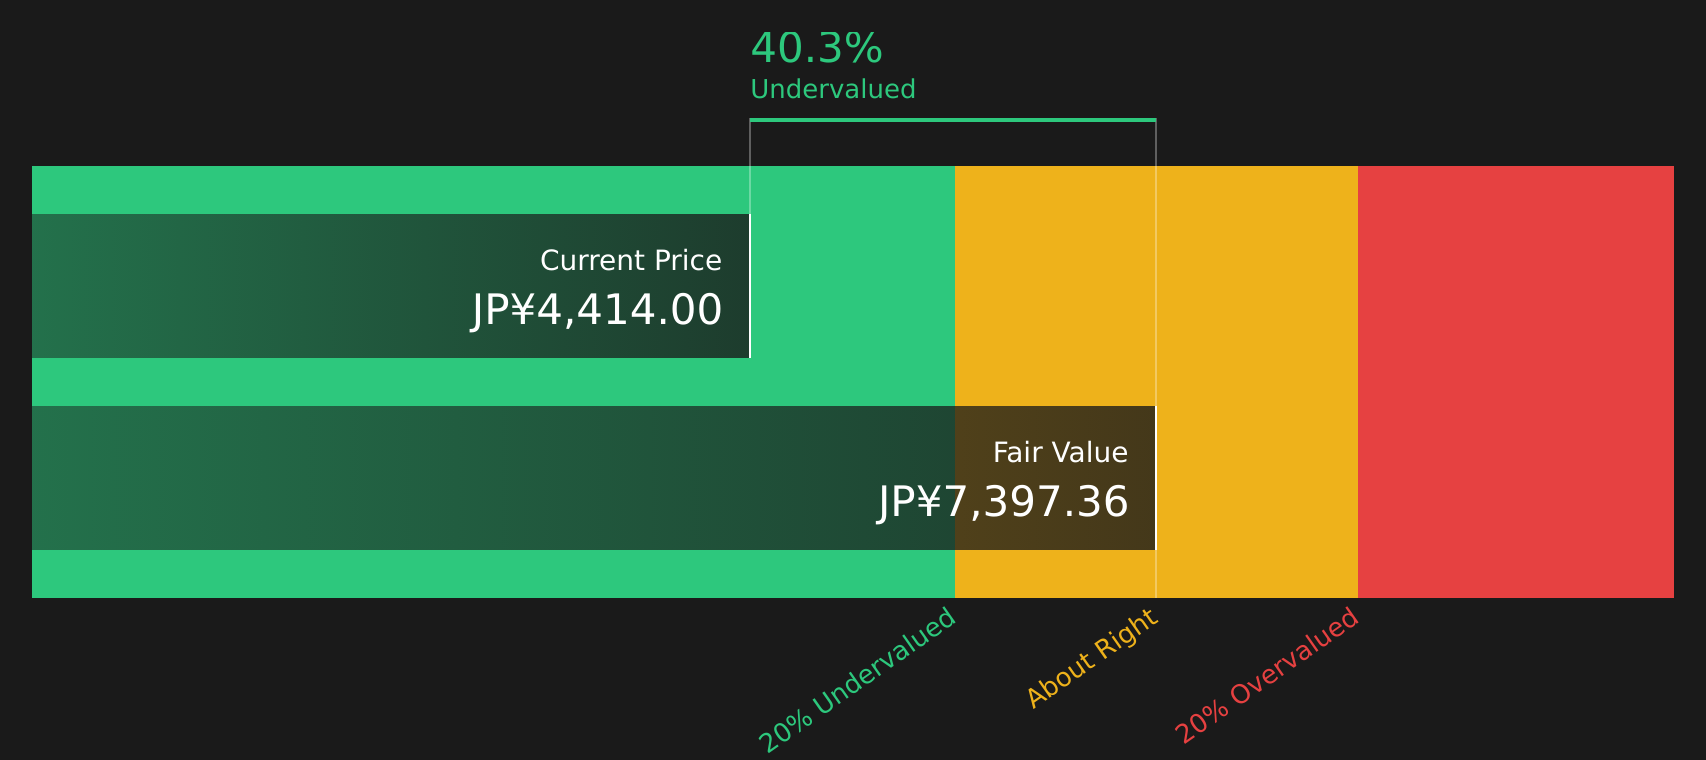
Simply Wall St performs a discounted cash flow (DCF) on every stock in the world every day (check out Toyo Seikan Group Holdings for example). We show the entire calculation in full. You can track the result in your watchlist or portfolio and be alerted when this changes, or use our stock screener to discover 26 high quality undervalued stocks. If you save a screener we even alert you when new companies match - so you never miss a potential opportunity.
Next Steps
With Toyo Seikan Group Holdings attracting fresh attention, it makes sense to review both the concerns and the positives before considering what it might mean for you. Take a moment to weigh the 2 key rewards and 1 important warning sign
Looking for more investment ideas beyond Toyo Seikan Group Holdings?
If Toyo Seikan Group Holdings has sharpened your focus on valuations and capital returns, it is worth broadening your watchlist with a few carefully filtered ideas.
- Target sturdier balance sheets and steady cash generation by reviewing companies in the solid balance sheet and fundamentals stocks screener (41 results).
- Spot potential value gaps by scanning the 26 high quality undervalued stocks, which combines quality fundamentals with prices that may not fully reflect them.
- Hunt for potential standouts before the crowd notices by checking the screener containing 69 high quality undiscovered gems.
This article by Simply Wall St is general in nature. We provide commentary based on historical data and analyst forecasts only using an unbiased methodology and our articles are not intended to be financial advice. It does not constitute a recommendation to buy or sell any stock, and does not take account of your objectives, or your financial situation. We aim to bring you long-term focused analysis driven by fundamental data. Note that our analysis may not factor in the latest price-sensitive company announcements or qualitative material. Simply Wall St has no position in any stocks mentioned.
Have feedback on this article? Concerned about the content? Get in touch with us directly. Alternatively, email editorial-team@simplywallst.com