
Global's August 2026 Top Stock Picks Trading Below Estimated Value
In August 2026, global markets showed remarkable resilience, with major U.S. stock indexes reaching record highs driven by favorable corporate earnings and renewed enthusiasm for AI-related stocks. Despite geopolitical uncertainties and a cooling labor market, investor sentiment remained optimistic, highlighting the potential for finding undervalued opportunities in a buoyant market environment. In such conditions, identifying stocks trading below their estimated value can offer investors a chance to capitalize on potential growth while maintaining a diversified portfolio amidst fluctuating economic indicators.
Top 10 Undervalued Stocks Based On Cash Flows
| Name | Current Price | Fair Value (Est) | Discount (Est) |
| ZEAL Network (XTRA:TIMA) | €43.90 | €86.99 | 49.5% |
| Vitrolife (OM:VITR) | SEK91.85 | SEK181.79 | 49.5% |
| Shibaura Mechatronics (TSE:6590) | ¥4470.00 | ¥8763.87 | 49% |
| Pan-United (SGX:P52) | SGD1.58 | SGD3.14 | 49.7% |
| New Wave Group (OM:NEWA B) | SEK93.05 | SEK182.52 | 49% |
| Murapol (WSE:MUR) | PLN39.10 | PLN77.58 | 49.6% |
| Koskisen Oyj (HLSE:KOSKI) | €8.56 | €16.93 | 49.4% |
| Diagnostic Medical Systems (ENXTPA:ALDMS) | €1.08 | €2.13 | 49.4% |
| DEUTZ (XTRA:DEZ) | €10.23 | €20.18 | 49.3% |
| Borregaard (OB:BRG) | NOK156.60 | NOK308.79 | 49.3% |
Here we highlight a subset of our preferred stocks from the screener.
Shanghai Liangxin ElectricalLTD (SZSE:002706)
Overview: Shanghai Liangxin Electrical Co., LTD. manufactures and sells low-voltage electrical appliances both in China and internationally, with a market cap of approximately CN¥10.98 billion.
Operations: Shanghai Liangxin Electrical Co., LTD. generates revenue through the production and distribution of low-voltage electrical appliances across domestic and international markets.
Estimated Discount To Fair Value: 15.9%
Shanghai Liangxin Electrical LTD is trading at CN¥10.01, below its estimated future cash flow value of CN¥11.9, indicating potential undervaluation based on discounted cash flows. While revenue growth is forecasted at 17.4% annually, slower than the significant threshold, earnings are expected to grow significantly at 40.22% per year, outpacing the Chinese market average of 26.4%. However, a low return on equity forecast and unsustainable dividend coverage present concerns.
- In light of our recent growth report, it seems possible that Shanghai Liangxin ElectricalLTD's financial performance will exceed current levels.
- Take a closer look at Shanghai Liangxin ElectricalLTD's balance sheet health here in our report.

Bengo4.comInc (TSE:6027)
Overview: Bengo4.com, Inc. provides online professional consultancy services in Japan and has a market cap of ¥71.77 billion.
Operations: The company generates revenue from its CloudSign Business, contributing ¥9.24 billion, and its Professional Support Business, which brings in ¥8.08 billion.
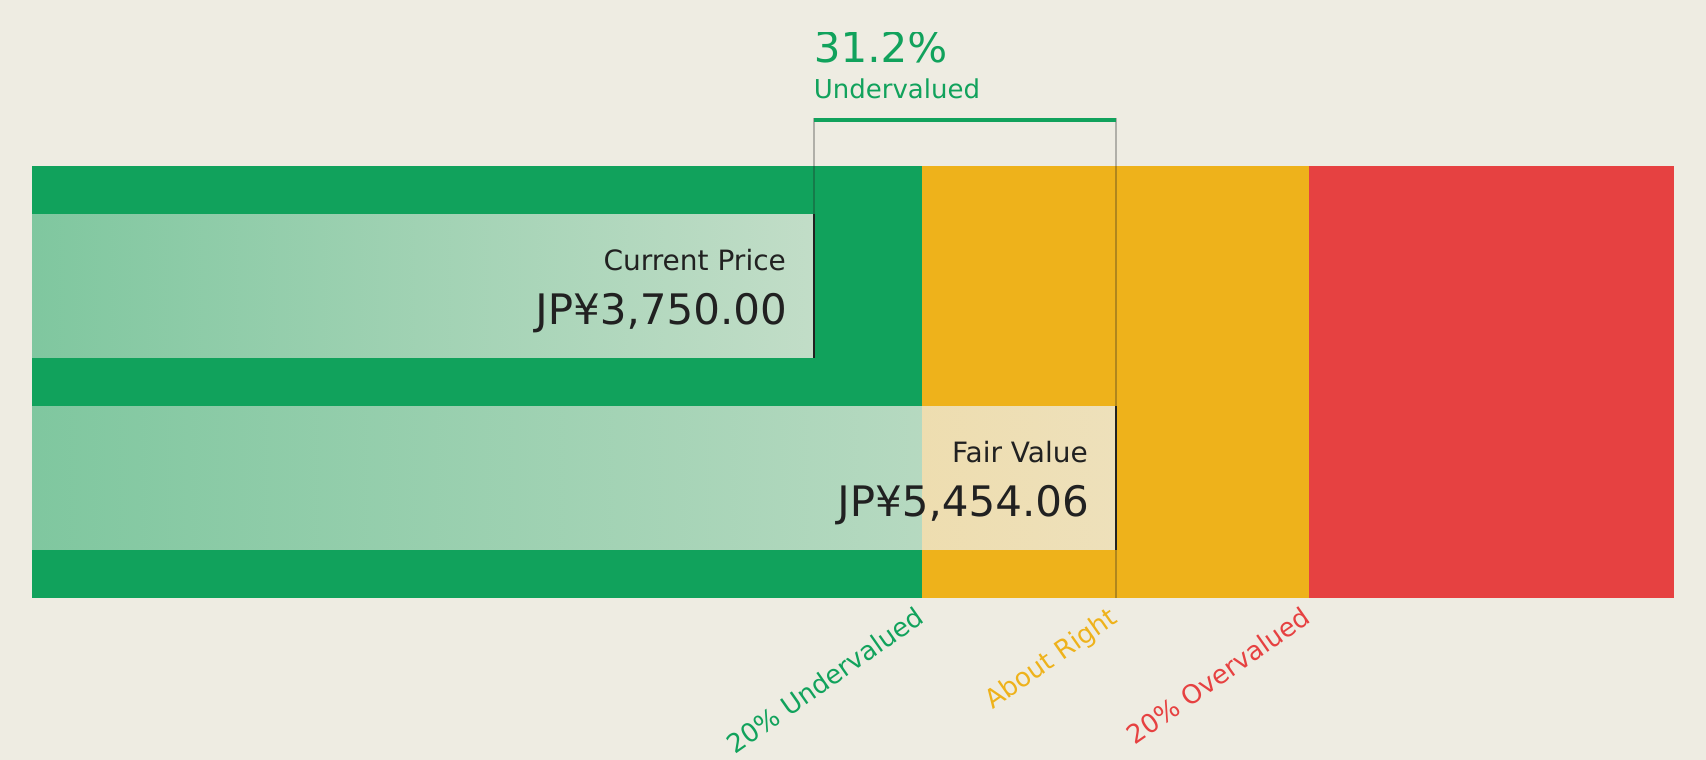
Estimated Discount To Fair Value: 31.7%
Bengo4.com Inc., trading at ¥3,705, is undervalued based on its discounted cash flow valuation of ¥5,420.73. Despite a highly volatile share price recently, the company shows strong earnings growth prospects at 33.85% annually over the next three years, surpassing Japan's market average of 8.9%. Recent earnings reported an increase in sales and net income compared to last year. A recent share buyback program aims to enhance long-term corporate value.
- Our expertly prepared growth report on Bengo4.comInc implies its future financial outlook may be stronger than recent results.
- Click here to discover the nuances of Bengo4.comInc with our detailed financial health report.
Quanta Computer (TWSE:2382)
Overview: Quanta Computer Inc. is engaged in the manufacturing, processing, and sale of laptop computers and cloud-computing server-related products across various international markets including the United States, Mainland China, the Netherlands, and Japan, with a market cap of NT$1.25 trillion.
Operations: The company's revenue primarily comes from its Electronics Sector, which generated NT$5.07 billion.
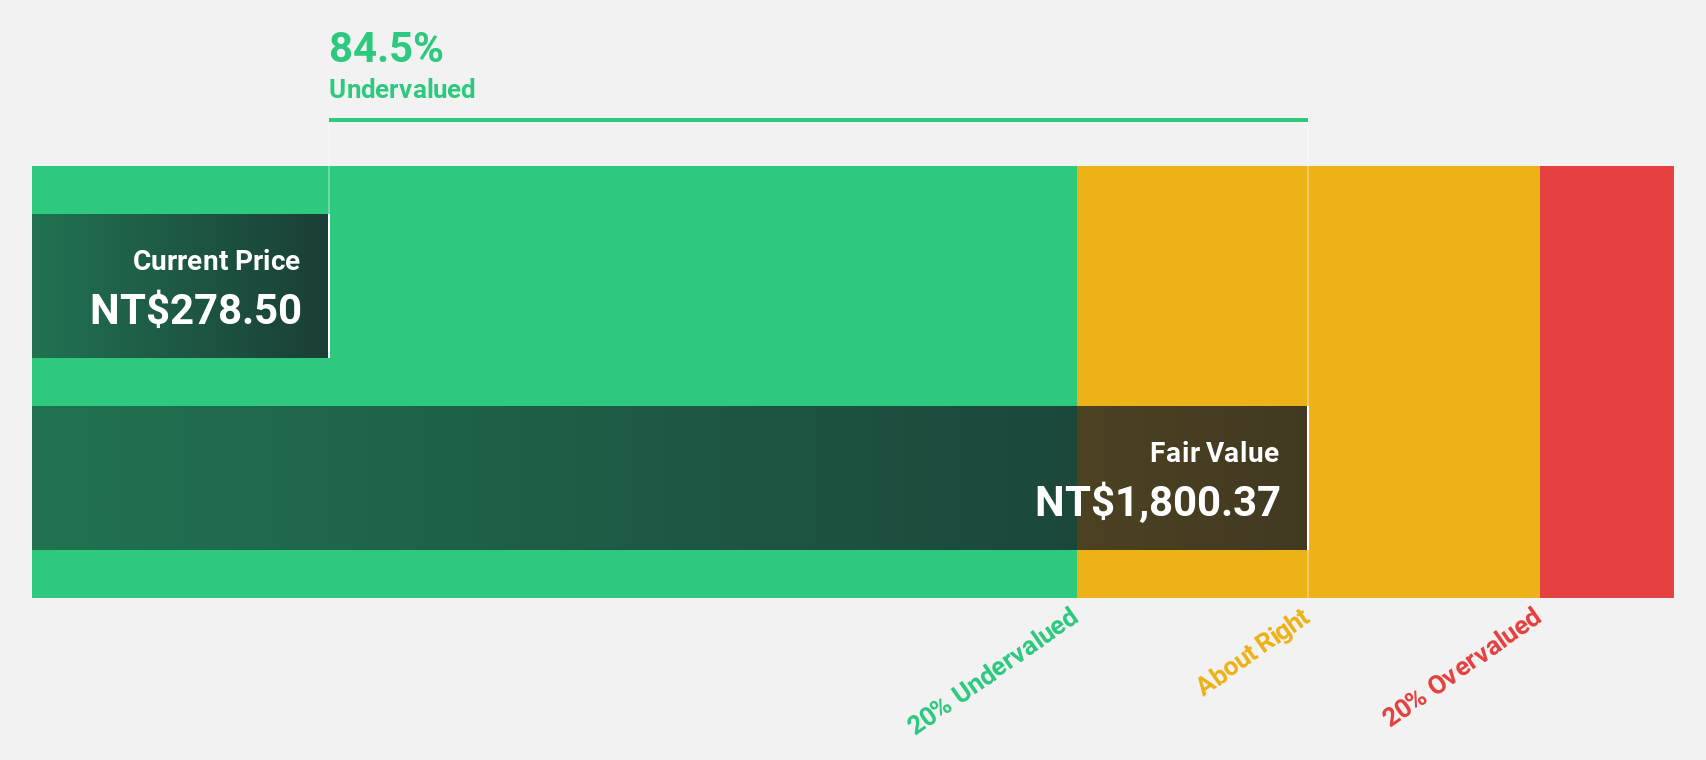
Estimated Discount To Fair Value: 20.1%
Quanta Computer is trading at NT$328, below its estimated future cash flow value of NT$410.4, indicating undervaluation. Despite a dividend not fully covered by free cash flows, the company shows robust revenue growth forecasts of 29.6% annually, outpacing the TW market's 21.9%. Recent earnings revealed significant sales and net income increases compared to last year. A recent equity offering raised US$2.16 billion, potentially strengthening financial flexibility for future initiatives.
- Our earnings growth report unveils the potential for significant increases in Quanta Computer's future results.
- Click to explore a detailed breakdown of our findings in Quanta Computer's balance sheet health report.
Turning Ideas Into Actions
- Click this link to deep-dive into the 447 companies within our Undervalued Global Stocks Based On Cash Flows screener.
- Are any of these part of your asset mix? Tap into the analytical power of Simply Wall St's portfolio to get a 360-degree view on how they're shaping up.
- Maximize your investment potential with Simply Wall St, the comprehensive app that offers global market insights for free.
Looking For Alternative Opportunities?
- Explore high-performing small cap companies that haven't yet garnered significant analyst attention.
- Diversify your portfolio with solid dividend payers offering reliable income streams to weather potential market turbulence.
- Fuel your portfolio with companies showing strong growth potential, backed by optimistic outlooks both from analysts and management.
This article by Simply Wall St is general in nature. We provide commentary based on historical data and analyst forecasts only using an unbiased methodology and our articles are not intended to be financial advice. It does not constitute a recommendation to buy or sell any stock, and does not take account of your objectives, or your financial situation. We aim to bring you long-term focused analysis driven by fundamental data. Note that our analysis may not factor in the latest price-sensitive company announcements or qualitative material. Simply Wall St has no position in any stocks mentioned.
Have feedback on this article? Concerned about the content? Get in touch with us directly. Alternatively, email editorial-team@simplywallst.com