
Asian Market Value Stock Picks For Estimated Growth Opportunities
As Asian markets continue to navigate a complex landscape of geopolitical developments and economic shifts, investors are increasingly focused on identifying potential opportunities within the region. In this context, finding undervalued stocks with strong fundamentals can be a strategic approach to capitalizing on estimated growth prospects in the dynamic Asian market environment.
Top 10 Undervalued Stocks Based On Cash Flows In Asia
| Name | Current Price | Fair Value (Est) | Discount (Est) |
| WNC (TWSE:6285) | NT$246.50 | NT$479.77 | 48.6% |
| Visional (TSE:4194) | ¥9050.00 | ¥17736.20 | 49% |
| Rakus (TSE:3923) | ¥1094.00 | ¥2102.67 | 48% |
| Pan-United (SGX:P52) | SGD1.58 | SGD3.14 | 49.7% |
| Ningbo Sanxing Medical ElectricLtd (SHSE:601567) | CN¥15.68 | CN¥31.27 | 49.9% |
| Matrix Design (SZSE:301365) | CN¥38.42 | CN¥75.19 | 48.9% |
| Japan Eyewear Holdings (TSE:5889) | ¥2624.00 | ¥5060.58 | 48.1% |
| gremsInc (TSE:3150) | ¥2507.00 | ¥4900.55 | 48.8% |
| CMTXLtd (KOSDAQ:A388210) | ₩81700.00 | ₩156966.36 | 48% |
| Baycurrent (TSE:6532) | ¥7359.00 | ¥14371.68 | 48.8% |
Below we spotlight a couple of our favorites from our exclusive screener.
Busy Ming Group (SEHK:1768)
Overview: Busy Ming Group Co., Ltd., with a market cap of HK$86.01 billion, operates as a food and beverage retailer in China through its subsidiaries.
Operations: The company generates revenue from its grocery stores segment, amounting to CN¥66.17 billion.
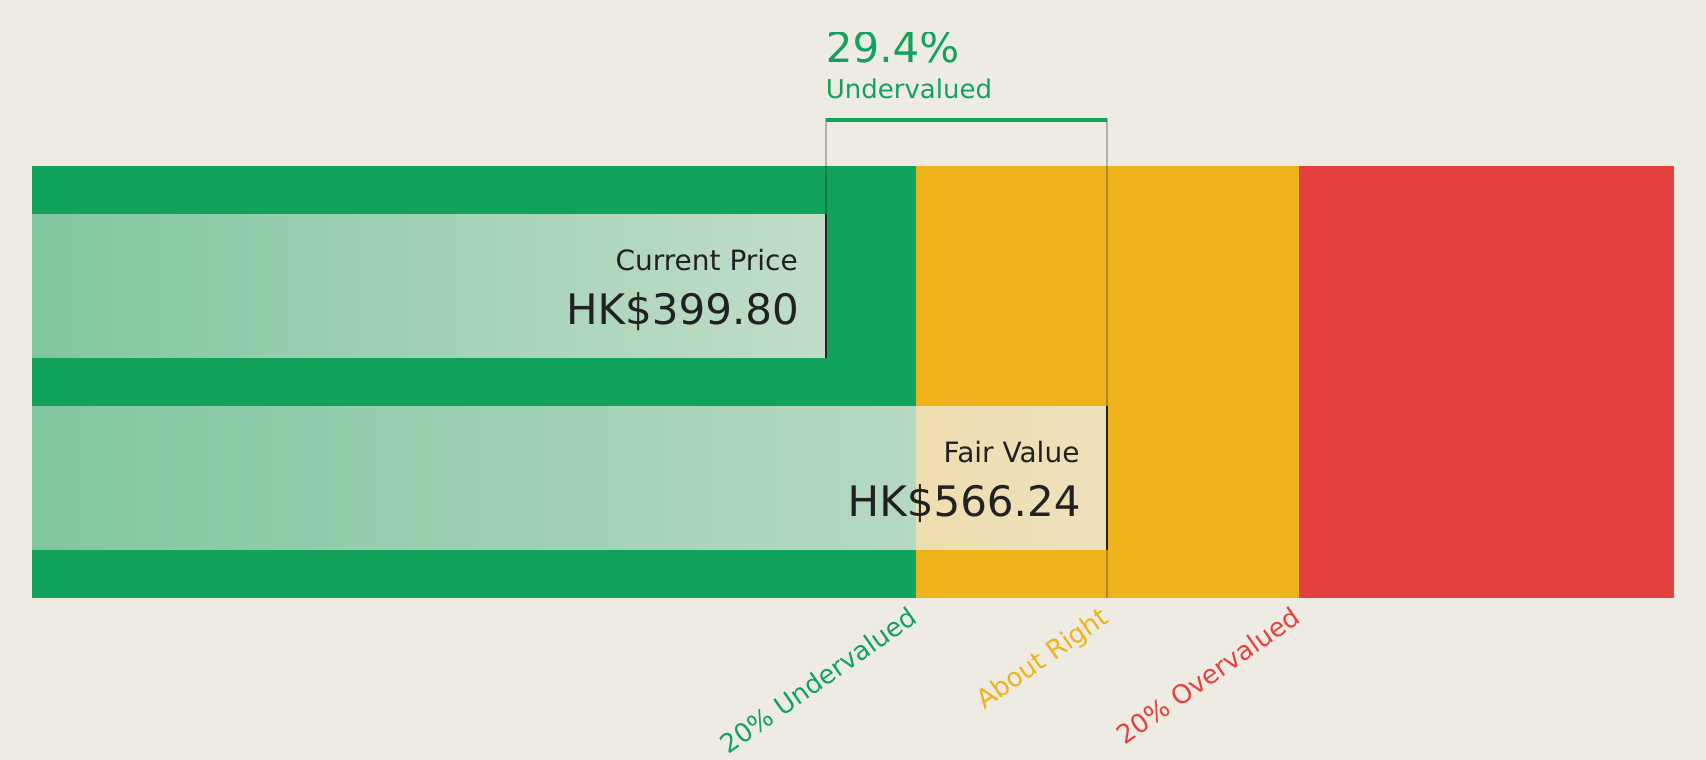
Estimated Discount To Fair Value: 30.2%
Busy Ming Group, trading at HK$395, is significantly undervalued based on discounted cash flow analysis with an estimated future cash flow value of HK$566.06. Earnings are projected to grow at 25.5% annually over the next three years, outpacing both revenue growth and the broader Hong Kong market. Recent inclusion in the S&P Global BMI Index may enhance visibility and investor interest, potentially influencing future valuations positively.
- Upon reviewing our latest growth report, Busy Ming Group's projected financial performance appears quite optimistic.
- Get an in-depth perspective on Busy Ming Group's balance sheet by reading our health report here.
Lenovo Group (SEHK:992)
Overview: Lenovo Group Limited is an investment holding company that develops, manufactures, and markets technology products and services with a market cap of approximately HK$432.92 billion.
Operations: The company's revenue is primarily derived from three segments: Intelligent Devices Group (IDG) at $58.94 billion, Solutions and Services Group (SSG) at $10.03 billion, and Infrastructure Solutions Group (ISG) at $19.19 billion.
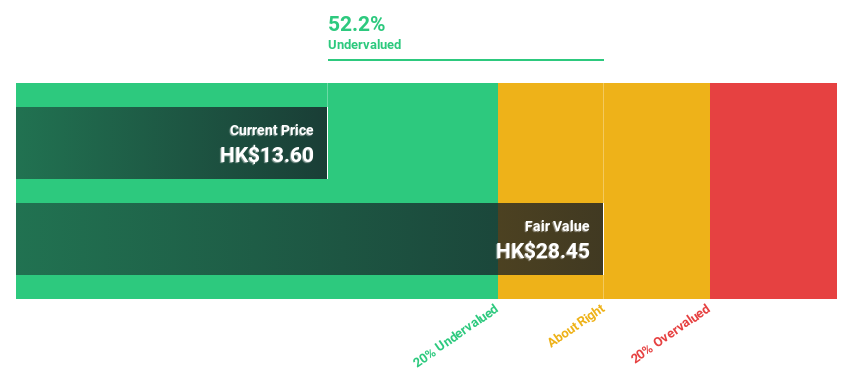
Estimated Discount To Fair Value: 41.5%
Lenovo Group, trading at HK$34.9, is undervalued based on discounted cash flow analysis with a future cash flow value of HK$59.66. Earnings are expected to grow significantly at 21.5% annually, surpassing the Hong Kong market's growth rate. Despite recent legal challenges and a net loss in Q1 2026, Lenovo's strategic alliances and expanding AI initiatives could bolster its financial performance and investor confidence moving forward.
- Our growth report here indicates Lenovo Group may be poised for an improving outlook.
- Unlock comprehensive insights into our analysis of Lenovo Group stock in this financial health report.
APT Medical (SHSE:688617)
Overview: APT Medical Inc. focuses on the R&D, production, and sale of cardiovascular interventional medical devices in China, with a market cap of CN¥30.69 billion.
Operations: The company's revenue is primarily derived from its medical products segment, totaling CN¥2.72 billion.
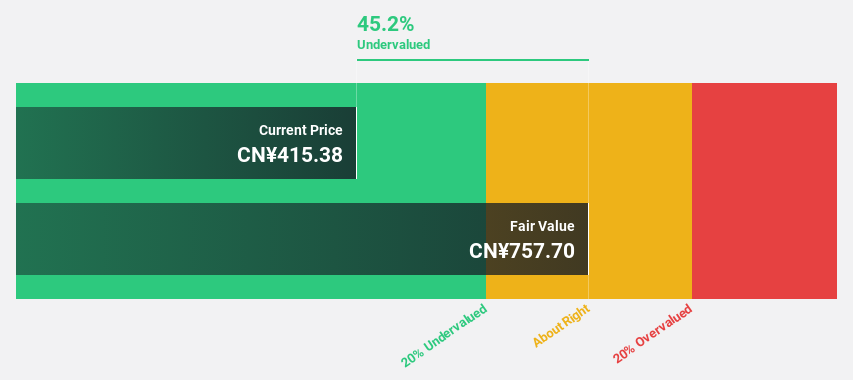
Estimated Discount To Fair Value: 46%
APT Medical, trading at CN¥217.5, is significantly undervalued with a future cash flow value of CN¥403.09. Despite earnings growth forecasts of 22.2% annually being slower than the market's, revenue is expected to grow faster at 21.8% per year compared to the market's 16.5%. The company recently completed a share buyback worth CN¥99.98 million, enhancing shareholder value despite an unstable dividend history and lower profit growth expectations than peers.
- Insights from our recent growth report point to a promising forecast for APT Medical's business outlook.
- Click to explore a detailed breakdown of our findings in APT Medical's balance sheet health report.
Key Takeaways
- Embark on your investment journey to our 211 Undervalued Asian Stocks Based On Cash Flows selection here.
- Invested in any of these stocks? Simplify your portfolio management with Simply Wall St and stay ahead with our alerts for any critical updates on your stocks.
- Unlock the power of informed investing with Simply Wall St, your free guide to navigating stock markets worldwide.
Interested In Other Possibilities?
- Explore high-performing small cap companies that haven't yet garnered significant analyst attention.
- Diversify your portfolio with solid dividend payers offering reliable income streams to weather potential market turbulence.
- Fuel your portfolio with companies showing strong growth potential, backed by optimistic outlooks both from analysts and management.
This article by Simply Wall St is general in nature. We provide commentary based on historical data and analyst forecasts only using an unbiased methodology and our articles are not intended to be financial advice. It does not constitute a recommendation to buy or sell any stock, and does not take account of your objectives, or your financial situation. We aim to bring you long-term focused analysis driven by fundamental data. Note that our analysis may not factor in the latest price-sensitive company announcements or qualitative material. Simply Wall St has no position in any stocks mentioned.
Have feedback on this article? Concerned about the content? Get in touch with us directly. Alternatively, email editorial-team@simplywallst.com