
We're Keeping An Eye On Sterling Metals' (CVE:SAG) Cash Burn Rate
Just because a business does not make any money, does not mean that the stock will go down. By way of example, Sterling Metals (CVE:SAG) has seen its share price rise 199% over the last year, delighting many shareholders. Having said that, unprofitable companies are risky because they could potentially burn through all their cash and become distressed.
Given its strong share price performance, we think it's worthwhile for Sterling Metals shareholders to consider whether its cash burn is concerning. In this article, we define cash burn as its annual (negative) free cash flow, which is the amount of money a company spends each year to fund its growth. The first step is to compare its cash burn with its cash reserves, to give us its 'cash runway'.
Does Sterling Metals Have A Long Cash Runway?
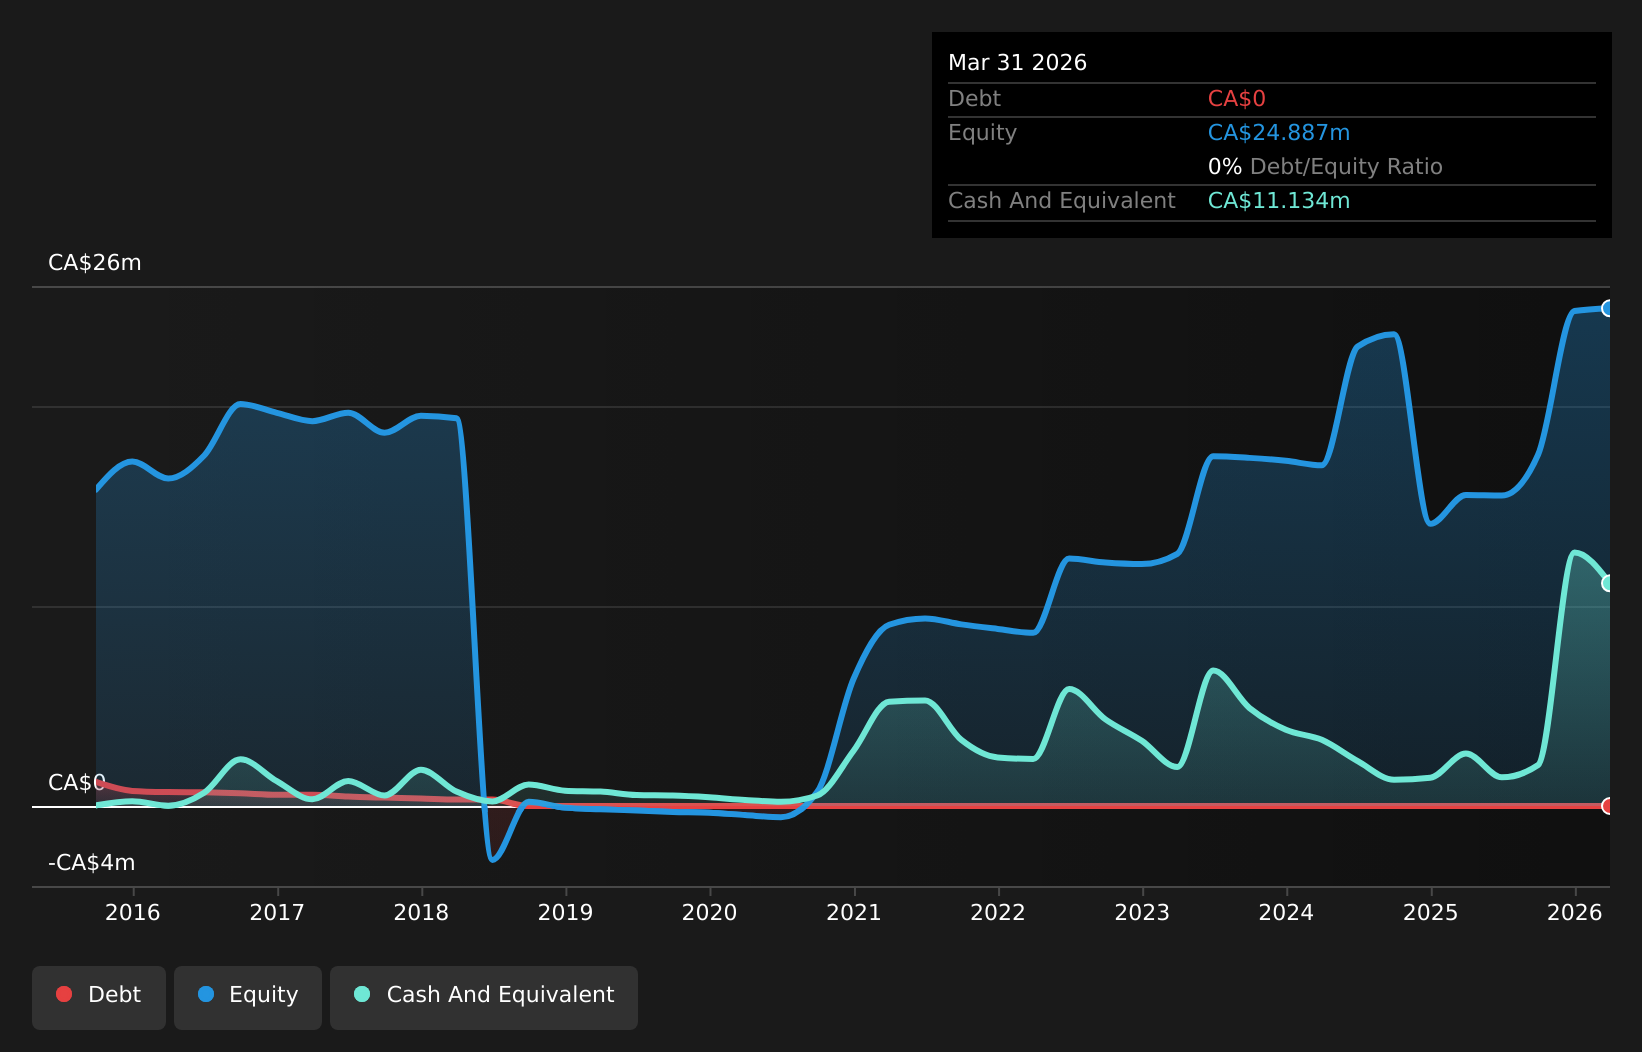
You can calculate a company's cash runway by dividing the amount of cash it has by the rate at which it is spending that cash. When Sterling Metals last reported its March 2026 balance sheet in May 2026, it had zero debt and cash worth CA$11m. In the last year, its cash burn was CA$8.3m. So it had a cash runway of approximately 16 months from March 2026. While that cash runway isn't too concerning, sensible holders would be peering into the distance, and considering what happens if the company runs out of cash. The image below shows how its cash balance has been changing over the last few years.
View our latest analysis for Sterling Metals
How Is Sterling Metals' Cash Burn Changing Over Time?
Because Sterling Metals isn't currently generating revenue, we consider it an early-stage business. So while we can't look to sales to understand growth, we can look at how the cash burn is changing to understand how expenditure is trending over time. The skyrocketing cash burn up 151% year on year certainly tests our nerves. It's fair to say that sort of rate of increase cannot be maintained for very long, without putting pressure on the balance sheet. Admittedly, we're a bit cautious of Sterling Metals due to its lack of significant operating revenues. So we'd generally prefer stocks from this list of stocks that have analysts forecasting growth.
How Hard Would It Be For Sterling Metals To Raise More Cash For Growth?
While Sterling Metals does have a solid cash runway, its cash burn trajectory may have some shareholders thinking ahead to when the company may need to raise more cash. Companies can raise capital through either debt or equity. Many companies end up issuing new shares to fund future growth. By comparing a company's annual cash burn to its total market capitalisation, we can estimate roughly how many shares it would have to issue in order to run the company for another year (at the same burn rate).
Since it has a market capitalisation of CA$62m, Sterling Metals' CA$8.3m in cash burn equates to about 13% of its market value. Given that situation, it's fair to say the company wouldn't have much trouble raising more cash for growth, but shareholders would be somewhat diluted.
So, Should We Worry About Sterling Metals' Cash Burn?
On this analysis of Sterling Metals' cash burn, we think its cash burn relative to its market cap was reassuring, while its increasing cash burn has us a bit worried. We don't think its cash burn is particularly problematic, but after considering the range of factors in this article, we do think shareholders should be monitoring how it changes over time. On another note, Sterling Metals has 5 warning signs (and 2 which can't be ignored) we think you should know about.
If you would prefer to check out another company with better fundamentals, then do not miss this free list of interesting companies, that have HIGH return on equity and low debt or this list of stocks which are all forecast to grow.
Have feedback on this article? Concerned about the content? Get in touch with us directly. Alternatively, email editorial-team (at) simplywallst.com.
This article by Simply Wall St is general in nature. We provide commentary based on historical data and analyst forecasts only using an unbiased methodology and our articles are not intended to be financial advice. It does not constitute a recommendation to buy or sell any stock, and does not take account of your objectives, or your financial situation. We aim to bring you long-term focused analysis driven by fundamental data. Note that our analysis may not factor in the latest price-sensitive company announcements or qualitative material. Simply Wall St has no position in any stocks mentioned.