
SLB (SLB) Stock May Look Below Fair Value On Cash Flow But About Right On Earnings
SLB has more than doubled investors' money over the past five years, yet its current share price near US$50.53 still sits well below an intrinsic value estimate from a Discounted Cash Flow (DCF) model that points to a 43.6% discount. With that backdrop, recent headlines around offshore stimulation work with Equinor and AI driven drilling operations with ADNOC are being weighed against a reported profit decline linked to disruptions in the Middle East.
- SLB has returned 103.0% over 5 years, which puts pressure on investors to judge whether the stock is already pricing in its major growth initiatives.
- Partnerships such as the Equinor vessel conversion and ADNOC's AI based real time operations center can support long term cash flow expectations, while geopolitical and operational disruptions highlighted by recent Middle East issues may limit how quickly those cash flows are realized.
- SLB screens as undervalued on a broad set of checks, with the company passing all 6. This suggests the broader valuation work still leans toward the stock being cheap relative to fundamentals.
The issue now is whether SLB's current discount to intrinsic value offers enough margin of safety given both its recent share price gains and the operational risks that have surfaced in 2026.
Find out why SLB's 60.4% return over the last year is lagging behind its peers.
Is SLB Still Cheap on Cash Flow?
The Discounted Cash Flow (DCF) method estimates what SLB is worth today based on projected future cash that flows to shareholders. For SLB, the model uses latest twelve month free cash flow of about $4.0b and assumes that cash generation grows from this base rather than shrinking, before settling into a more modest long run path.
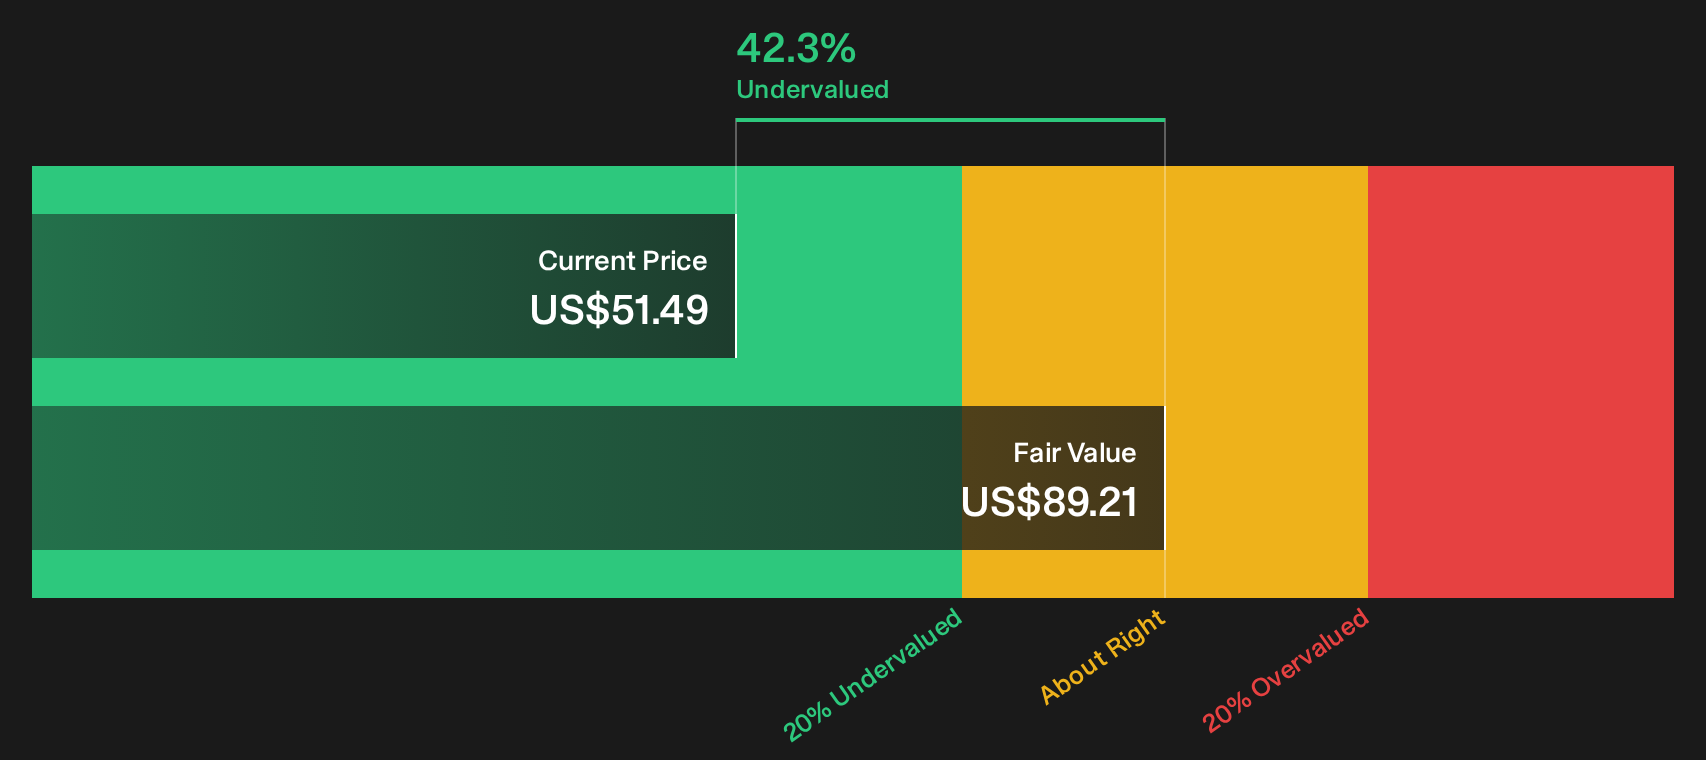
On these cash flow projections, the DCF model arrives at an estimated intrinsic value of about $89.66 per share, compared with the recent share price around $50.53. That gap implies the stock appears roughly 43.6% undervalued on this measure. The reported profit decline linked to war related disruptions in the Middle East helps explain why the market may be hesitant to fully price in the long dated cash flows that the model is using.
Taken together, the cash flow profile and current quote indicate that SLB stock appears undervalued relative to what this DCF model implies.
Our Discounted Cash Flow (DCF) analysis suggests SLB is undervalued by 43.6%. Track this in your watchlist or portfolio, or discover 52 more high quality undervalued stocks.
Is SLB Fairly Priced on Earnings?
P/E is a useful yardstick for SLB because the company is consistently followed on an earnings basis and sits in a mature, profit focused sector. Right now SLB trades on a P/E of about 24.2x, which is a discount to both the Energy Services industry average of roughly 26.3x and the peer group average near 33.3x.
The fair P/E ratio for SLB, based on its earnings profile, size and risk mix, is estimated at about 26.2x. That is only slightly above the current market multiple, so the gap is not wide enough to clearly indicate that the stock is either cheap or expensive on earnings alone. Taken together with the earlier cash flow analysis, this suggests that the market is broadly in line with the model on what SLB’s earnings stream is worth today.
On the P/E yardstick, SLB stock currently appears to be trading at roughly fair value.

See what the numbers say about this price — find out in our valuation breakdown.
The SLB Narrative: What Would Justify Today's Price?
Simply Wall St Narratives pick up where the SLB valuation puzzle leaves off and explain which growth, margin and earnings paths would need to occur for the stock to be worth materially more or less than today’s price. Each one turns SLB's fair value into a thesis about the business that you can track over time, rather than a single snapshot, and they sit on Simply Wall St's Community page.
Community views on SLB sit far apart, with one camp leaning into digital growth and another focused on energy transition risks.
Bull case: 29% undervalued
"The integration will accelerate the creation of a globally dominant, end-to-end production optimization platform, significantly increasing market share, accelerating international revenue synergies, and delivering sustained EBITDA margin expansion…"
Read the full Bull Case to see why SLB could be undervalued
Bear case: roughly fairly valued
"The accelerating shift by governments and major corporations towards ambitious decarbonization and net-zero targets is set to reduce global demand for oilfield services over the next decade, shrinking the addressable market for Schlumberger (SLB) and placing long-term pressure on revenue growth…"
Read the full Bear Case to see why SLB could be overvalued
Do you think there's more to the story for SLB? Head over to our Community to see what others are saying!
The Bottom Line
SLB still screens as undervalued on the Discounted Cash Flow (DCF) view, while the P/E signal is closer to about right compared with peers. That combination suggests the market is cautious about how and when future cash flows materialise, especially given recent operational disruptions. The key question is whether SLB can convert its current project pipeline and technology partnerships into steady, resilient cash generation. The crux for investors is whether the current discount reflects a genuine opportunity in those long term cash flows or whether it is a fair penalty for the geopolitical and execution risks highlighted in 2026.
This article by Simply Wall St is general in nature. We provide commentary based on historical data and analyst forecasts only using an unbiased methodology and our articles are not intended to be financial advice. It does not constitute a recommendation to buy or sell any stock, and does not take account of your objectives, or your financial situation. We aim to bring you long-term focused analysis driven by fundamental data. Note that our analysis may not factor in the latest price-sensitive company announcements or qualitative material. Simply Wall St has no position in any stocks mentioned.
Have feedback on this article? Concerned about the content? Get in touch with us directly. Alternatively, email editorial-team@simplywallst.com