
Brother Industries (TSE:6448) Shares Climbed, What Is Behind The Fresh Attention?
Why Brother Industries Stock Is Back in Focus After Q1 Earnings
Brother Industries (TSE:6448) is drawing fresh attention after releasing first quarter results for the period ended June 30, 2026. The company reported higher sales, net income, and earnings per share compared with a year earlier.
See our latest analysis for Brother Industries.
The earnings release on 6 August appears to have sharpened investor focus, with the share price now at ¥4,561 and a 30 day share price return of 22.12%. Over the past year, Brother Industries has delivered an 85.41% total shareholder return, which may indicate sustained momentum rather than a short lived reaction.
If strong quarterly numbers have you looking beyond a single stock, this can be a useful moment to widen your radar and check out 37 robotics and automation stocks
Bulls point to Brother Industries' strong Q1 figures and sharp 1 year return. Bears worry the recent share price jump already prices in the good news. Which side does the valuation evidence support next?
Price-to-Earnings of 12.3x: Is It Justified for Brother Industries?
On the latest figures, Brother Industries trades on a P/E of 12.3x, and the stock is described as good value relative to several reference points despite its strong recent share price performance.
The P/E ratio compares the current share price with earnings per share. For a company like Brother Industries, which reports earnings and has a track record of profit growth, P/E is a common shorthand for how much investors are paying for each unit of earnings.
Brother Industries is flagged as good value based on its P/E of 12.3x compared with an estimated fair P/E of 16.3x, and also when lined up against a selected peer group average of 19.6x. This suggests the current rating is lower than levels the market could move towards if earnings quality and growth trends stay consistent with what the data currently shows.
Against the broader JP Tech industry, though, the picture is more mixed. Brother Industries is described as slightly expensive versus the sector average P/E of 11.8x, even while its recent earnings growth has outpaced the industry. Investors weighing this gap may see it as the market assigning a modest premium to the company compared with the sector, yet still a discount compared with its own fair ratio and peers.
Explore the SWS fair ratio for Brother Industries.
Result: Price-to-Earnings of 12.3x (UNDERVALUED)
However, Brother Industries still faces risks if recent share price gains fade or if broader JP tech sector valuations shift away from current P/E levels.
Find out about the key risks to this Brother Industries narrative.
Another View Using The SWS DCF Model
While the P/E of 12.3x suggests Brother Industries looks inexpensive against its own fair ratio and peers, the SWS DCF model points to an estimated value of ¥6,258.7 per share versus the current ¥4,561. That implies the stock screens as undervalued on cash flow terms too. How much weight do you put on earnings multiples versus long term cash flows when you assess an opportunity?
Look into how the SWS DCF model arrives at its fair value.
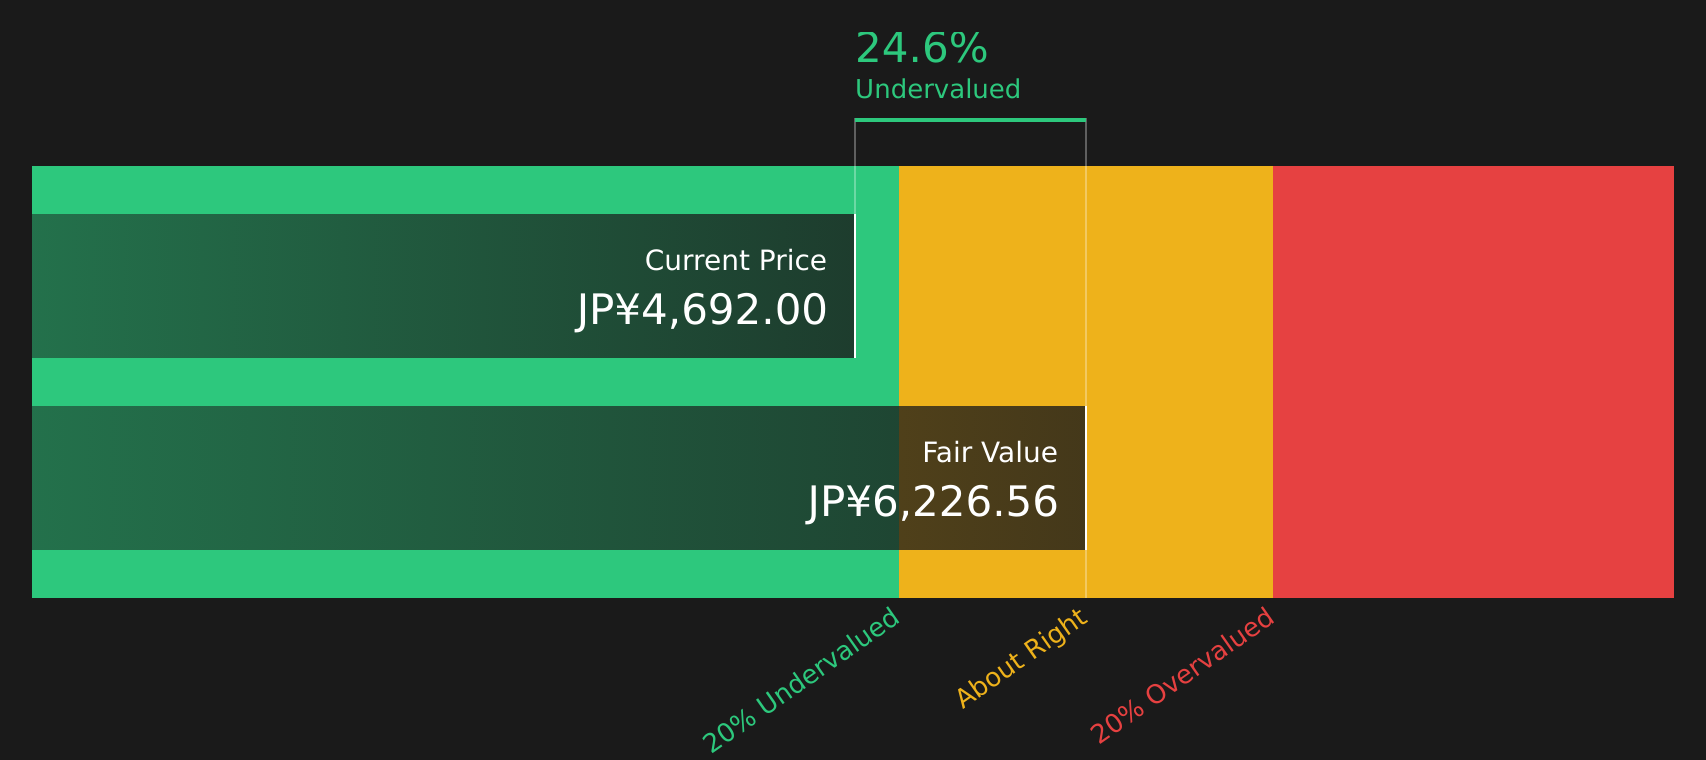
Simply Wall St performs a discounted cash flow (DCF) on every stock in the world every day (check out Brother Industries for example). We show the entire calculation in full. You can track the result in your watchlist or portfolio and be alerted when this changes, or use our stock screener to discover 18 high quality undervalued stocks. If you save a screener we even alert you when new companies match - so you never miss a potential opportunity.
Next Steps
With mixed signals on value and sentiment around Brother Industries, this is a good time to review the full picture and decide where you stand. You can weigh the upside potential against the concerns by checking 3 key rewards and 1 important warning sign.
Looking For More Investment Ideas Beyond Brother Industries?
If Brother Industries has sharpened your focus on opportunities, do not stop here. Use this momentum to scan for other stocks that match your goals and risk comfort.
- Target stability first and let potential upside follow by checking companies with resilient finances through the 56 resilient stocks with low risk scores.
- Hunt for quality at a sensible price by reviewing companies that currently screen as potentially attractively priced using the 18 high quality undervalued stocks.
- Spot future standouts early by focusing on underfollowed businesses with strong fundamentals inside the screener containing 63 high quality undiscovered gems.
This article by Simply Wall St is general in nature. We provide commentary based on historical data and analyst forecasts only using an unbiased methodology and our articles are not intended to be financial advice. It does not constitute a recommendation to buy or sell any stock, and does not take account of your objectives, or your financial situation. We aim to bring you long-term focused analysis driven by fundamental data. Note that our analysis may not factor in the latest price-sensitive company announcements or qualitative material. Simply Wall St has no position in any stocks mentioned.
Have feedback on this article? Concerned about the content? Get in touch with us directly. Alternatively, email editorial-team@simplywallst.com