
Gold surged 7% in a single week and returned to 4,300 US dollars: from the escape of 10 billion dollars to the return of funds, how far can this round of rebound go?
The Zhitong Finance App learned that after experiencing a trough period of large-scale capital withdrawal, gold ushered in a strong rebound. According to the data, the price of gold rose 7% last week, setting the best weekly performance since February this year, recovering the key technical moving average in one fell swoop and ending the downward trend since March.
This breakthrough rise has reversed the previous pessimism in the market. As capital flows back, the central bank continues to buy gold, and expectations of the Fed's interest rate hike cool down, a new round of rising gold prices is gradually being established.
Multiple factors resonate to reach the 4,300 US dollars/ounce mark
The rebound in gold was extremely strong in this round. Gold futures surged 4% in a single day last Wednesday to reach the 4,300 US dollars/ounce mark, the biggest one-day increase since February. The price of gold simultaneously hit a seven-week high, breaking through the technical support of the 50-day moving average and breaking the previous pattern of weak shocks that had continued for several months.
This strong rebound is the result of a combination of lower US Treasury yields, weakening US dollar, and market optimism about Iran's nuclear negotiations and the resumption of shipping in the Strait of Hormuz.
The “collapse” of US non-farm payrolls data has strengthened the market's optimism about gold. According to the data, the number of non-farm payrolls in the US unexpectedly fell by 23,000 in July, a sharp departure from the market's previous forecast of an increase of 83,000. Weak employment data caused the market to quickly adjust predictions on the Federal Reserve's interest rate policy.
According to the CME Federal Reserve Interest Rate Observation Tool, the probability that the Fed will raise interest rates in September fell to 41.9%, down from 67% a week ago. Market expectations for further interest rate hikes by the Federal Reserve have cooled significantly.
The ultimate reversal of capital: from the escape of 10 billion dollars to the return of funds
The previous downturn in gold stemmed from an unprecedented retreat of investors. According to Baird Strategas data, the rolling 125-day capital flow of precious metals ETFs once peaked at 40 billion US dollars in February, but fell to close to -20 billion US dollars at the beginning of last week, down more than 55 billion US dollars from the peak in February, the lowest level recorded in 2015. The “gold rush” at the beginning of the year is close to dissipating.
Precious metal ETF capital flow reversal
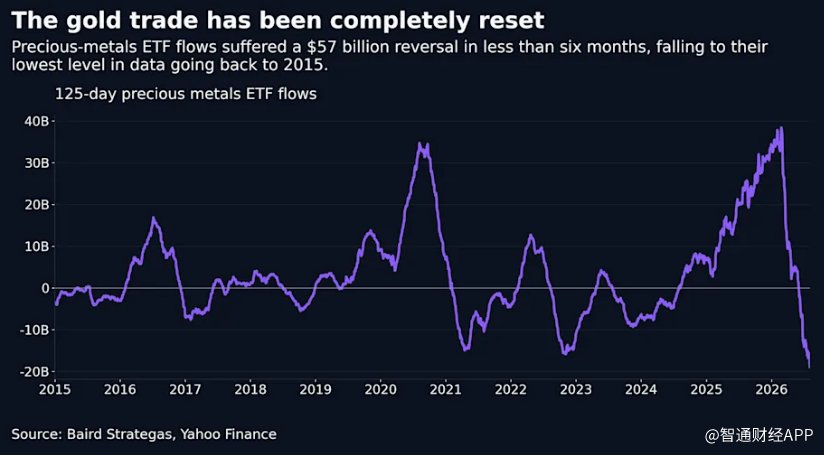
Today, the first buyers are returning. China's gold ETF recently attracted capital inflows for 14 consecutive trading days, absorbing a total of about 1.2 billion US dollars. Global physical gold ETFs also reversed two consecutive months of net outflows in July. According to data from the World Gold Council, global physical gold ETFs increased net by 23.5 tons in July, worth about US$2.97 billion. Among them, European listed funds contributed the most, increasing their holdings by 17.3 tons (about 2 billion US dollars) in a single month, and the total inflow of British and Swiss funds was 1.5 billion US dollars. North American funds increased their holdings slightly by 0.3 tons (about 71 million US dollars), while Asian funds continued to steadily increase their holdings by 4.8 tons (about US$616 million).
This funding structure has left an unusual pattern for gold: long-term buyers have never completely left the market, and fast money and ETF investors have mostly paid out.
Goldman Sachs estimates that commodity trading advisors (CTAs) still hold about $9 billion in short gold positions. Under Goldman Sachs's most optimistic forecast scenario, these funds could switch to over $10 billion long positions in gold within the next month, with a potential reversal of over $20 billion.
The central bank continues to buy money to build a solid bottom
In addition to the return of private investors, the official sector's gold purchase actions continue to provide structural support for gold prices. The People's Bank of China increased its gold reserves by 20 tons in July, the biggest monthly net increase since October 2023, and also extended the record of continuous holdings increase to 21 months.
World Gold Council analyst Krishan Gopaul said that the increase in holdings in July has brought China's official net purchases to 60 tons since this year, and the total reserves have risen to 2,366 tons. Other official agencies are following suit: the Czech National Bank increased its holdings by 1.7 tons in July, with a cumulative increase of 12 tons during the year. The Bank of Korea's restart of gold purchases after a lapse of 13 years has also attracted market attention.
According to the latest survey by the World Gold Council, 89% of reserve managers expect global official gold holdings to rise in the next year, while a record 45% of respondents expect their institutions to increase their gold holdings. Goldman Sachs senior trader Tony King said that the central bank's purchase of gold provided bottom support for the price of gold around 4,000 US dollars.
What is the next step for gold?
The short-term path is relatively clear. Gold needs to hold the $4,000 integer mark and stabilize the downward trend line that has already been broken through. On the upward side, its 200-day EMA (close to 4,500 US dollars) is an important resistance level, and it is also a technical threshold that must be crossed for further increases in gold prices.
The bond market remains the biggest obstacle. Gold does not generate interest, so rising real interest rates will increase the opportunity cost of holding gold. However, historical experience shows that when the market has deep concerns about the prospects for inflation, the expansion of fiscal deficits, or the statutory credit system, nominal yields and gold can break away from conventional logic and rise at the same time.
Todd Thorne, ETF strategist at Baird Strategas, said, “[ETF] capital flows show that the threshold for tactical long exposure is very low.” As gold prices break through key technical levels, bears have huge potential to make up, and central bank purchases continue to bottom out, there is still room for the gold rebound.
UBS analysts pointed out that although short-term trading risks and volatility still exist, in the medium to long term, gold is expected to gradually approach 5,000 US dollars/ounce in 2027.
Looking ahead to the future market, US inflation data, the progress of the US-Iran negotiations, the situation in the Strait of Hormuz, and subsequent remarks by Federal Reserve officials will be the focus of close attention from investors. Evolution beyond expectations in either direction may become a catalyst for the next phase of the trend in gold prices.
As of press release, spot gold was reported at 4320.66 US dollars/ounce, down 0.5% during the day.