
Discover Asian Stocks That May Be Priced Below Intrinsic Value In August 2026
In recent months, Asian markets have experienced a mixed performance, with fluctuations in technology stocks and policy shifts influencing investor sentiment. Amidst these developments, identifying stocks that may be undervalued relative to their intrinsic value can offer potential opportunities for investors seeking to capitalize on market inefficiencies.
Top 10 Undervalued Stocks Based On Cash Flows In Asia
| Name | Current Price | Fair Value (Est) | Discount (Est) |
| Visional (TSE:4194) | ¥8878.00 | ¥17749.44 | 50% |
| Rakuten Bank (TSE:5838) | ¥5520.00 | ¥10832.18 | 49% |
| Ningbo Sanxing Medical ElectricLtd (SHSE:601567) | CN¥16.12 | CN¥31.43 | 48.7% |
| NEXTIN (KOSDAQ:A348210) | ₩31850.00 | ₩62326.56 | 48.9% |
| Matrix Design (SZSE:301365) | CN¥38.53 | CN¥75.19 | 48.8% |
| Loncin Motor (SHSE:603766) | CN¥14.01 | CN¥27.47 | 49% |
| Livero (TSE:9245) | ¥2135.00 | ¥4232.22 | 49.6% |
| ISU Petasys (KOSE:A007660) | ₩83100.00 | ₩161536.58 | 48.6% |
| Hanwha Engine (KOSE:A082740) | ₩43450.00 | ₩86878.80 | 50% |
| gremsInc (TSE:3150) | ¥2462.00 | ¥4912.25 | 49.9% |
Let's review some notable picks from our screened stocks.
Foxconn Industrial Internet (SHSE:601138)
Overview: Foxconn Industrial Internet Co., Ltd. and its subsidiaries offer smart manufacturing and industrial internet services across various regions including Mexico, Vietnam, Singapore, Mainland China, and internationally, with a market cap of approximately CN¥1.35 trillion.
Operations: Foxconn Industrial Internet generates revenue through its provision of smart manufacturing and industrial internet services across multiple regions, including Mexico, Vietnam, Singapore, and Mainland China.
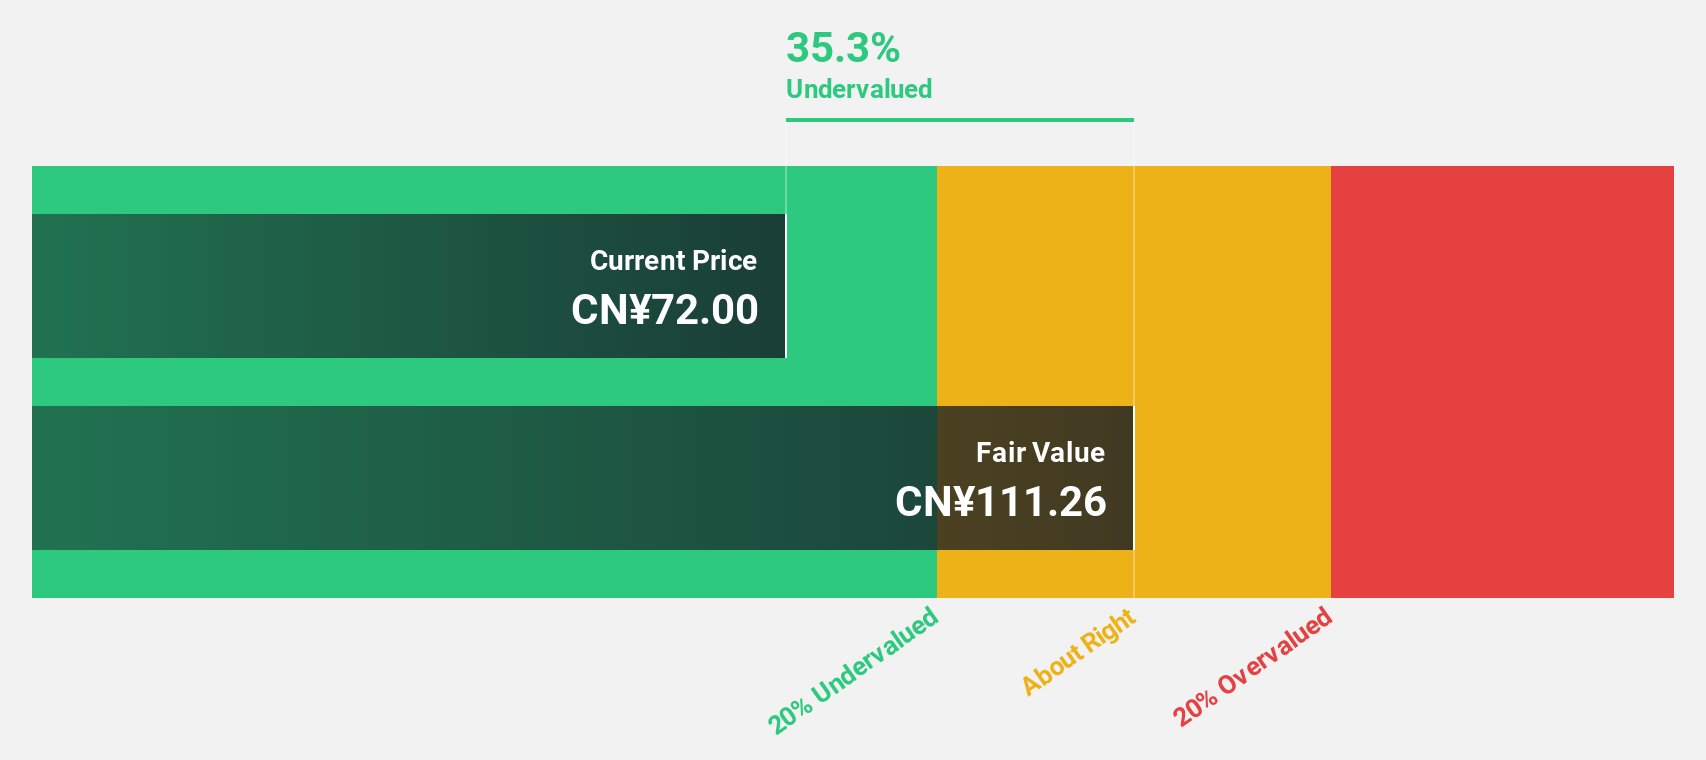
Estimated Discount To Fair Value: 33.8%
Foxconn Industrial Internet is trading significantly below its estimated future cash flow value of CNY 103.12, indicating potential undervaluation. The company has announced a share buyback program worth up to CNY 2 billion, aimed at maintaining shareholder value. Despite high earnings growth forecasts of over 30% annually and strong return on equity expectations, the stock's dividend yield is not well covered by free cash flows. Additionally, its share price has been volatile recently.
- In light of our recent growth report, it seems possible that Foxconn Industrial Internet's financial performance will exceed current levels.
- Get an in-depth perspective on Foxconn Industrial Internet's balance sheet by reading our health report here.
Wus Printed Circuit (Kunshan) (SZSE:002463)
Overview: Wus Printed Circuit (Kunshan) Co., Ltd. is involved in the production, sale, and after-sales services of various printed circuit boards in China, with a market cap of CN¥225.54 billion.
Operations: Wus Printed Circuit (Kunshan) Co., Ltd. generates revenue through the production, sales, and after-sales services of diverse printed circuit boards within China.
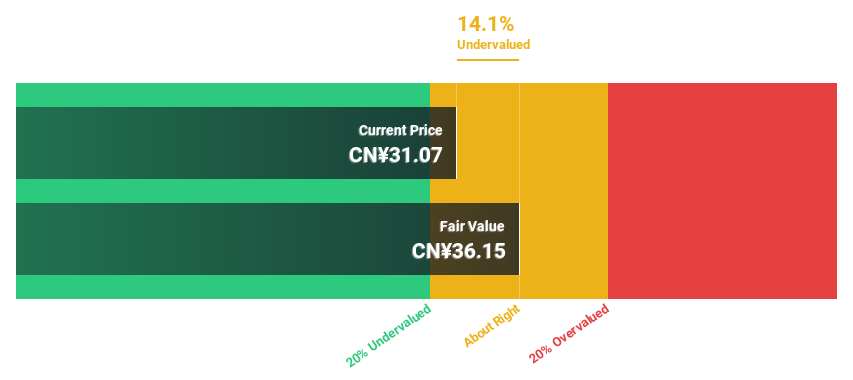
Estimated Discount To Fair Value: 27.8%
Wus Printed Circuit (Kunshan) is trading at CN¥117.2, significantly below its estimated future cash flow value of CN¥162.43, highlighting potential undervaluation. The company's revenue and earnings are forecast to grow faster than the market at 27.8% and 30.6% per year, respectively, with a high return on equity expected in three years (34.5%). However, its dividend yield remains inadequately covered by free cash flows amidst recent share price volatility.
- Our expertly prepared growth report on Wus Printed Circuit (Kunshan) implies its future financial outlook may be stronger than recent results.
- Click here to discover the nuances of Wus Printed Circuit (Kunshan) with our detailed financial health report.
Avary Holding(Shenzhen)Co (SZSE:002938)
Overview: Avary Holding(Shenzhen)Co., Limited specializes in the design, development, manufacture, and sale of printed circuit boards across China, the United States, Asia, and Europe with a market cap of CN¥216.61 billion.
Operations: The company's revenue primarily comes from its printed circuit board segment, totaling CN¥39.05 billion.
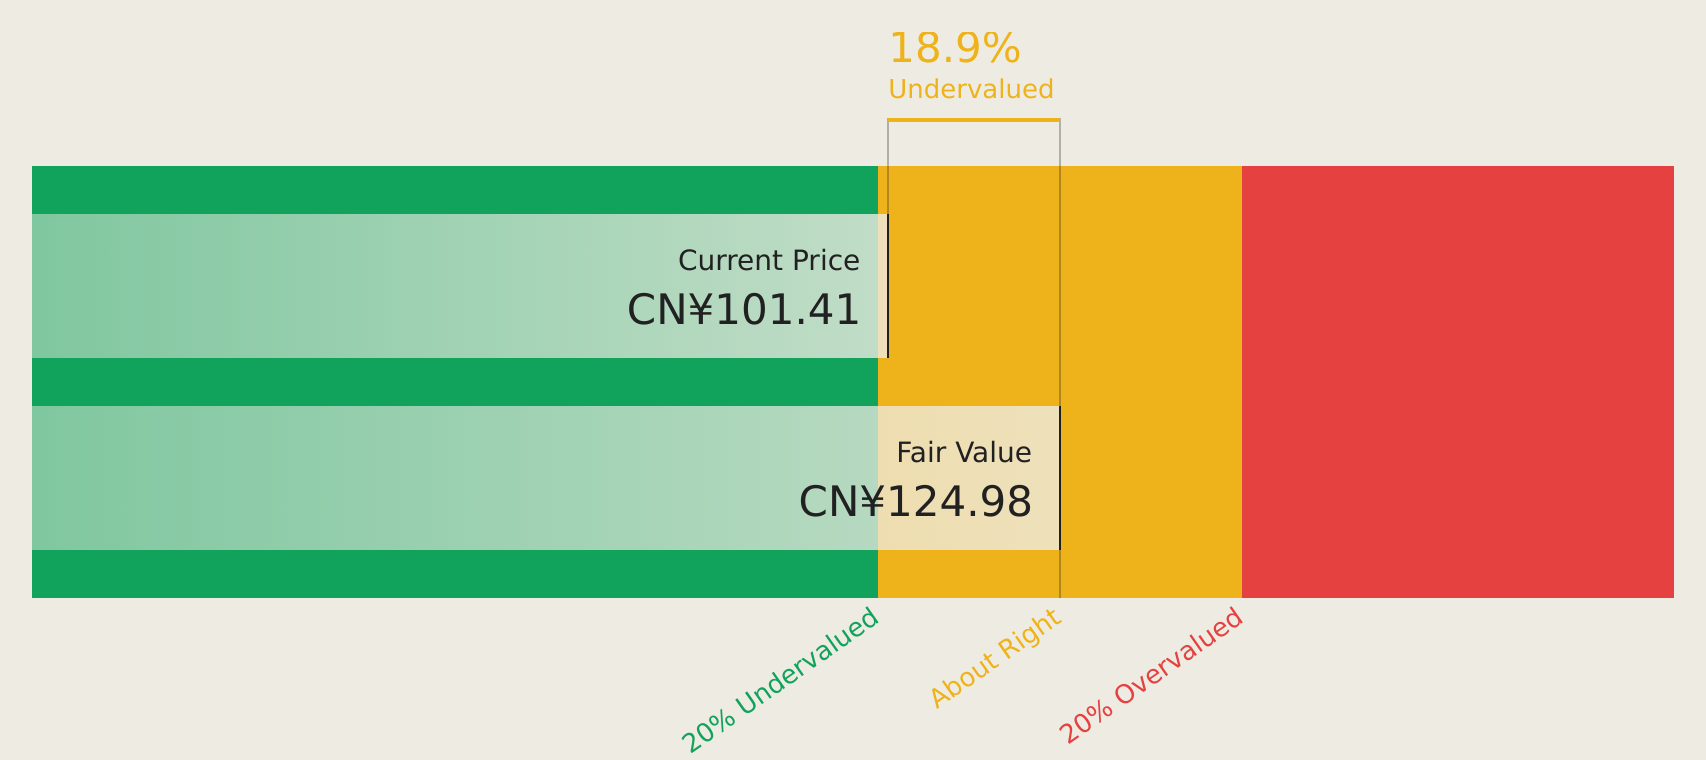
Estimated Discount To Fair Value: 25.3%
Avary Holding (Shenzhen) Co. is trading at CN¥93.85, well below its estimated future cash flow value of CN¥125.58, suggesting it may be undervalued based on cash flows. The company's earnings are projected to grow significantly at 26.1% annually over the next three years, outpacing the Chinese market's growth rate. However, its dividend yield of 1.07% is not adequately covered by free cash flows and recent share price volatility persists amidst a large private placement announcement for up to CN¥9.6 billion in July 2026.
- The analysis detailed in our Avary Holding(Shenzhen)Co growth report hints at robust future financial performance.
- Navigate through the intricacies of Avary Holding(Shenzhen)Co with our comprehensive financial health report here.
Make It Happen
- Explore the 218 names from our Undervalued Asian Stocks Based On Cash Flows screener here.
- Got skin in the game with these stocks? Elevate how you manage them by using Simply Wall St's portfolio, where intuitive tools await to help optimize your investment outcomes.
- Discover a world of investment opportunities with Simply Wall St's free app and access unparalleled stock analysis across all markets.
Searching for a Fresh Perspective?
- Explore high-performing small cap companies that haven't yet garnered significant analyst attention.
- Diversify your portfolio with solid dividend payers offering reliable income streams to weather potential market turbulence.
- Fuel your portfolio with companies showing strong growth potential, backed by optimistic outlooks both from analysts and management.
This article by Simply Wall St is general in nature. We provide commentary based on historical data and analyst forecasts only using an unbiased methodology and our articles are not intended to be financial advice. It does not constitute a recommendation to buy or sell any stock, and does not take account of your objectives, or your financial situation. We aim to bring you long-term focused analysis driven by fundamental data. Note that our analysis may not factor in the latest price-sensitive company announcements or qualitative material. Simply Wall St has no position in any stocks mentioned.
Have feedback on this article? Concerned about the content? Get in touch with us directly. Alternatively, email editorial-team@simplywallst.com