
3 ASX Stocks That May Be Undervalued By Up To 49.7%
As the S&P/ASX 200 reaches a 52-week high, investors are keenly observing market movements amidst mixed results from Wall Street and ongoing geopolitical developments. In this environment, identifying undervalued stocks can be particularly appealing, as they may offer potential value opportunities despite broader market fluctuations.
Top 10 Undervalued Stocks Based On Cash Flows In Australia
| Name | Current Price | Fair Value (Est) | Discount (Est) |
| Xero (ASX:XRO) | A$75.45 | A$145.76 | 48.2% |
| Superloop (ASX:SLC) | A$3.21 | A$5.61 | 42.8% |
| NRW Holdings (ASX:NWH) | A$7.20 | A$13.66 | 47.3% |
| Navigator Global Investments (ASX:NGI) | A$2.59 | A$4.52 | 42.7% |
| Mesoblast (ASX:MSB) | A$2.23 | A$4.31 | 48.2% |
| Lovisa Holdings (ASX:LOV) | A$26.90 | A$53.46 | 49.7% |
| Frontier Digital Ventures (ASX:FDV) | A$0.325 | A$0.64 | 48.9% |
| Bellevue Gold (ASX:BGL) | A$1.455 | A$2.60 | 44% |
| Aroa Biosurgery (ASX:ARX) | A$0.565 | A$1.00 | 43.7% |
| Advanced Braking Technology (ASX:ABV) | A$0.115 | A$0.20 | 42.8% |
We'll examine a selection from our screener results.
Lovisa Holdings (ASX:LOV)
Overview: Lovisa Holdings Limited operates in the retail sector, focusing on the sale of fashion jewelry and accessories, with a market capitalization of A$2.98 billion.
Operations: The company generates revenue primarily through its retail sale of fashion jewelry and accessories, amounting to A$892.86 million.
Estimated Discount To Fair Value: 49.7%
Lovisa Holdings is trading at A$26.9, significantly below its estimated future cash flow value of A$53.46, suggesting it may be undervalued based on discounted cash flows. The company's earnings have grown 24.3% annually over the past five years and are forecast to continue growing at 15.2% per year, outpacing the broader Australian market's growth rate of 11.4%. However, its dividend yield of 2.86% is not well covered by earnings, indicating potential sustainability concerns.
- The analysis detailed in our Lovisa Holdings growth report hints at robust future financial performance.
- Delve into the full analysis health report here for a deeper understanding of Lovisa Holdings.
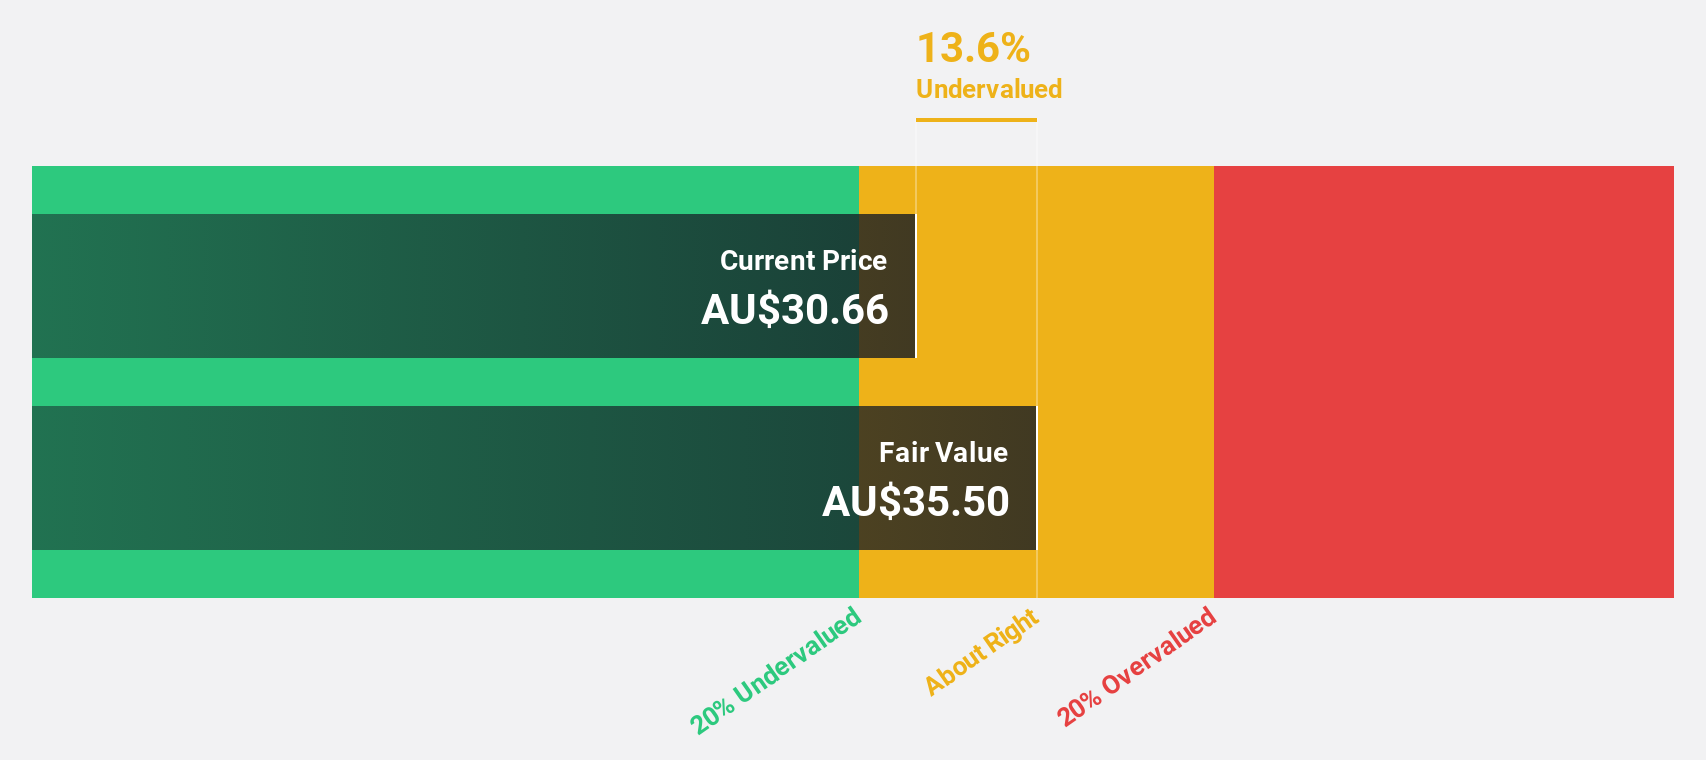
Magellan Financial Group (ASX:MFG)
Overview: Magellan Financial Group Limited is a publicly owned investment manager with a market capitalization of A$3.05 billion.
Operations: The company's revenue is primarily derived from Investment Management Services at A$231.87 million, followed by Partnerships & Investments at A$45.73 million and Corporate activities contributing A$6.26 million.
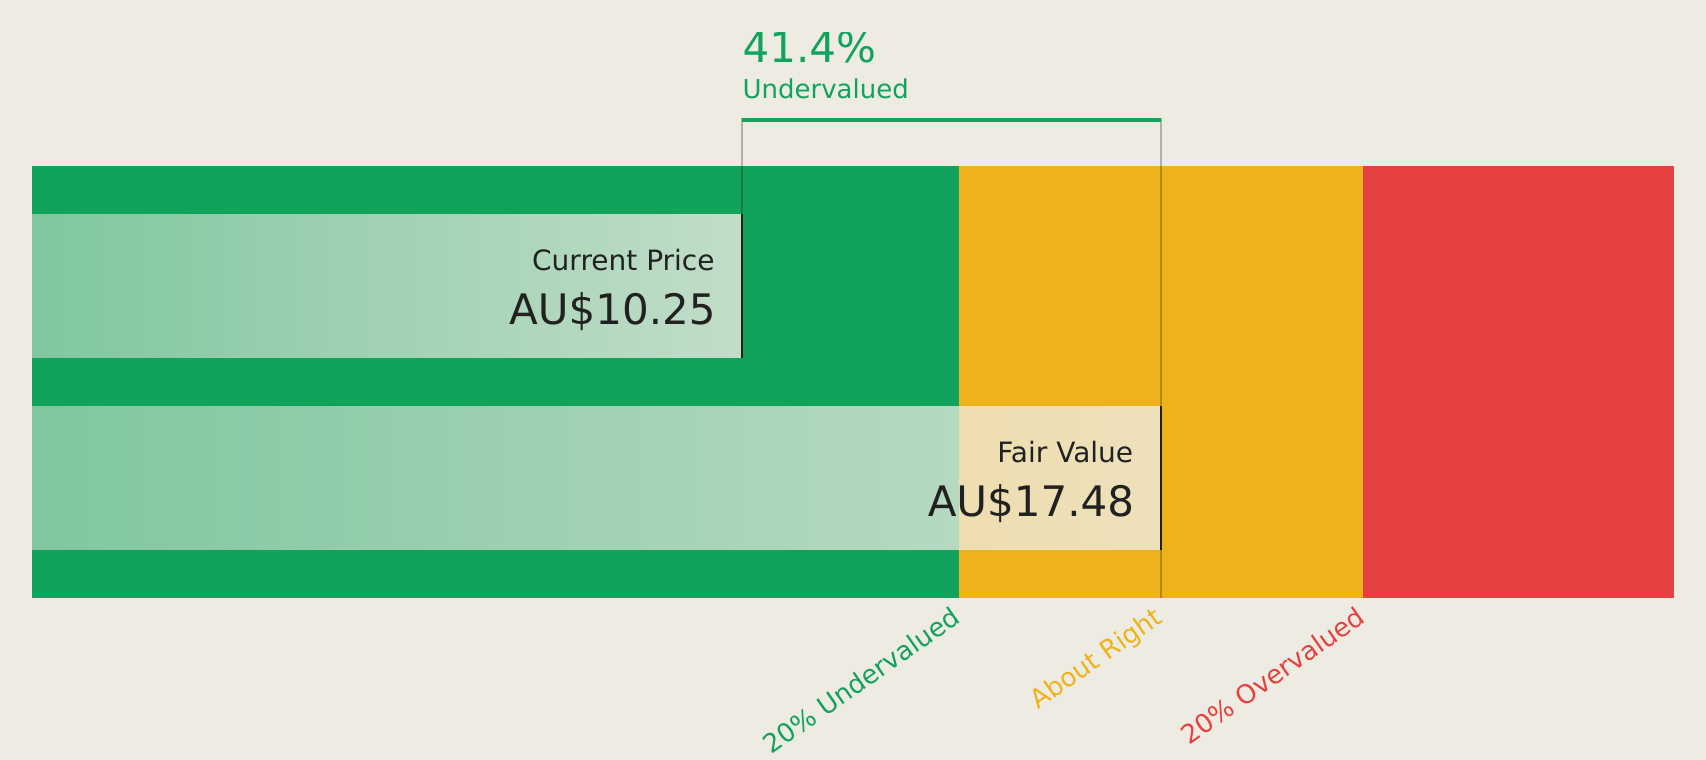
Estimated Discount To Fair Value: 40.3%
Magellan Financial Group is trading at A$10.43, considerably below its estimated future cash flow value of A$17.46, indicating potential undervaluation based on discounted cash flows. Despite being forecast to grow revenue by 25.6% annually, surpassing the Australian market's growth rate, shareholder dilution occurred recently and its dividend yield of 8.28% isn't well covered by free cash flows. Recent executive changes include Brian Benari as CEO and Gavin Buchanan as CFO, potentially impacting strategic direction.
- In light of our recent growth report, it seems possible that Magellan Financial Group's financial performance will exceed current levels.
- Take a closer look at Magellan Financial Group's balance sheet health here in our report.
Supply Network (ASX:SNL)
Overview: Supply Network Limited operates by supplying aftermarket parts to the commercial vehicle market in Australia and New Zealand, with a market cap of A$1.55 billion.
Operations: The company's revenue from providing aftermarket parts for the commercial vehicle market is A$378.42 million.
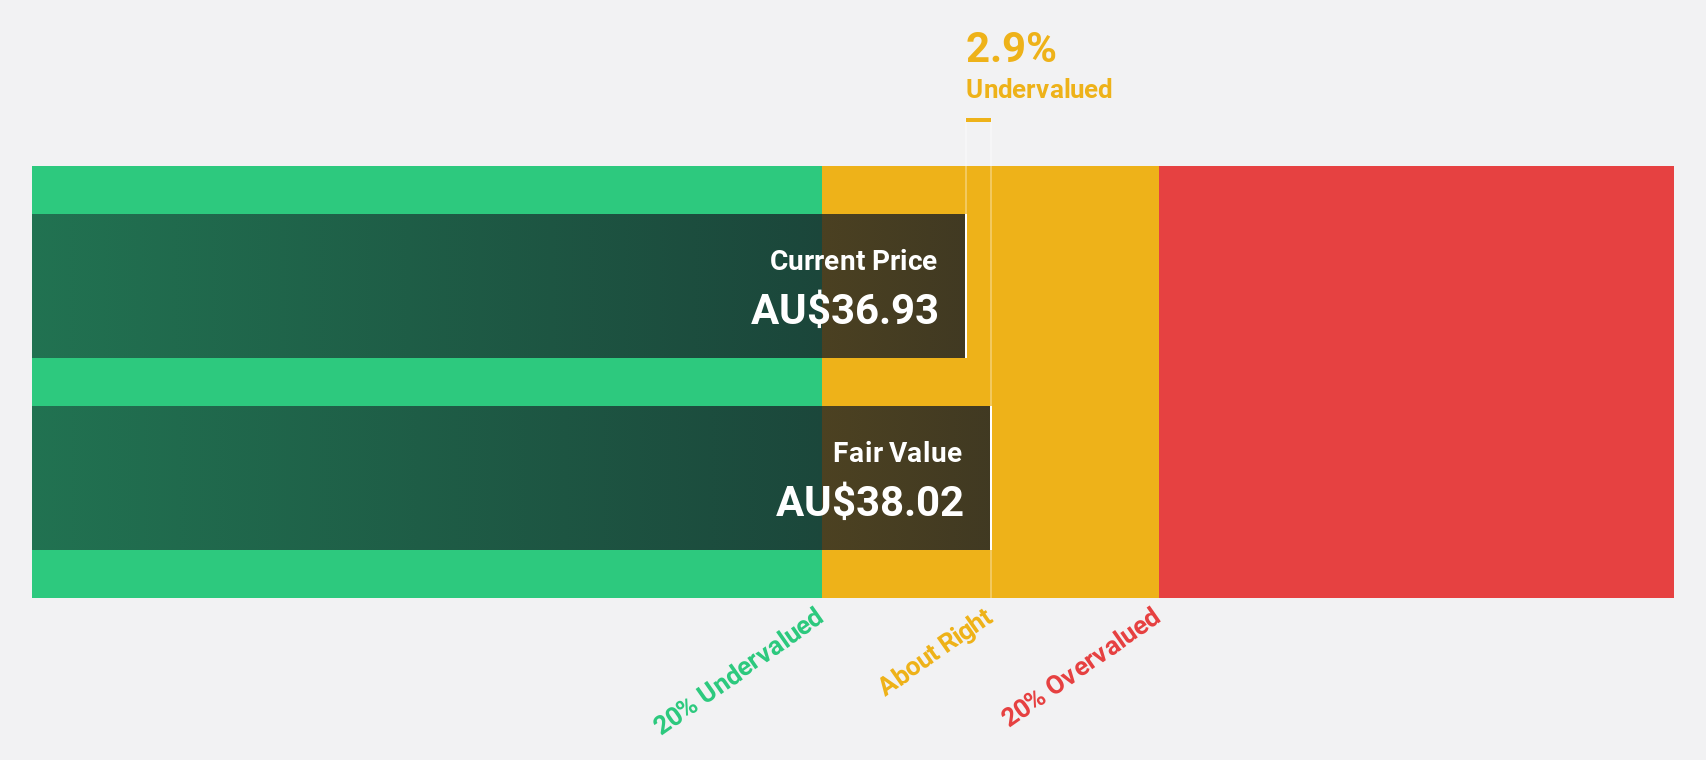
Estimated Discount To Fair Value: 18%
Supply Network Limited is trading at A$35.5, below its estimated future cash flow value of A$43.27, suggesting undervaluation based on discounted cash flows. Earnings are forecast to grow 14.11% annually, outpacing the Australian market's 11.4%. Recent guidance targets a revenue increase of A$50 million for fiscal year 2027. The company announced a dividend increase to 44 cents per share and appointed Ms Karen Phin as Chairman of the Audit and Risk Committee following board changes.
- Our growth report here indicates Supply Network may be poised for an improving outlook.
- Get an in-depth perspective on Supply Network's balance sheet by reading our health report here.
Where To Now?
- Explore the 40 names from our Undervalued ASX Stocks Based On Cash Flows screener here.
- Have you diversified into these companies? Leverage the power of Simply Wall St's portfolio to keep a close eye on market movements affecting your investments.
- Streamline your investment strategy with Simply Wall St's app for free and benefit from extensive research on stocks across all corners of the world.
Looking For Alternative Opportunities?
- Explore high-performing small cap companies that haven't yet garnered significant analyst attention.
- Diversify your portfolio with solid dividend payers offering reliable income streams to weather potential market turbulence.
- Fuel your portfolio with companies showing strong growth potential, backed by optimistic outlooks both from analysts and management.
This article by Simply Wall St is general in nature. We provide commentary based on historical data and analyst forecasts only using an unbiased methodology and our articles are not intended to be financial advice. It does not constitute a recommendation to buy or sell any stock, and does not take account of your objectives, or your financial situation. We aim to bring you long-term focused analysis driven by fundamental data. Note that our analysis may not factor in the latest price-sensitive company announcements or qualitative material. Simply Wall St has no position in any stocks mentioned.
Have feedback on this article? Concerned about the content? Get in touch with us directly. Alternatively, email editorial-team@simplywallst.com