
Undiscovered Gems in Asia to Explore This August 2026
As we navigate through a period marked by mixed performances in global markets and cautious economic indicators, the Asian market presents intriguing opportunities for investors seeking potential growth. In this environment, identifying stocks with strong fundamentals and resilience to market volatility can be key to uncovering undiscovered gems.
Top 10 Undiscovered Gems With Strong Fundamentals In Asia
| Name | Debt To Equity | Revenue Growth | Earnings Growth | Health Rating |
|---|---|---|---|---|
| CNMC Goldmine Holdings | 0.84% | 32.52% | 78.36% | ★★★★★★ |
| Cybozu | 0.18% | 16.90% | 52.26% | ★★★★★★ |
| DeHua TB New Decoration MaterialLtd | 0.63% | 1.50% | 2.14% | ★★★★★★ |
| Beijing Chunlizhengda Medical Instruments | NA | -2.67% | -10.59% | ★★★★★★ |
| Nippon Carbide Industries | 16.74% | 1.99% | -4.81% | ★★★★★★ |
| Base | NA | 11.66% | 17.63% | ★★★★★★ |
| SPRIX | 11.35% | 8.50% | -9.69% | ★★★★★★ |
| Zhejiang Jolly PharmaceuticalLTD | 21.31% | 17.83% | 29.70% | ★★★★★☆ |
| uSonar | 6.83% | 17.99% | 43.73% | ★★★★★☆ |
| Shengda ResourcesLtd | 57.58% | 8.61% | 9.90% | ★★★☆☆☆ |
Let's explore several standout options from the results in the screener.
SUNIC SYSTEM (KOSDAQ:A171090)
Simply Wall St Value Rating: ★★★★★☆
Overview: SUNIC SYSTEM Co., Ltd. is a Korean company specializing in the manufacture and sale of OLED deposition equipment and semiconductor vacuum equipment, with a market cap of ₩638.04 billion.
Operations: The primary revenue stream for SUNIC SYSTEM comes from the manufacture and sales of display manufacturing equipment, generating ₩522.50 billion. The company's market cap stands at ₩638.04 billion.
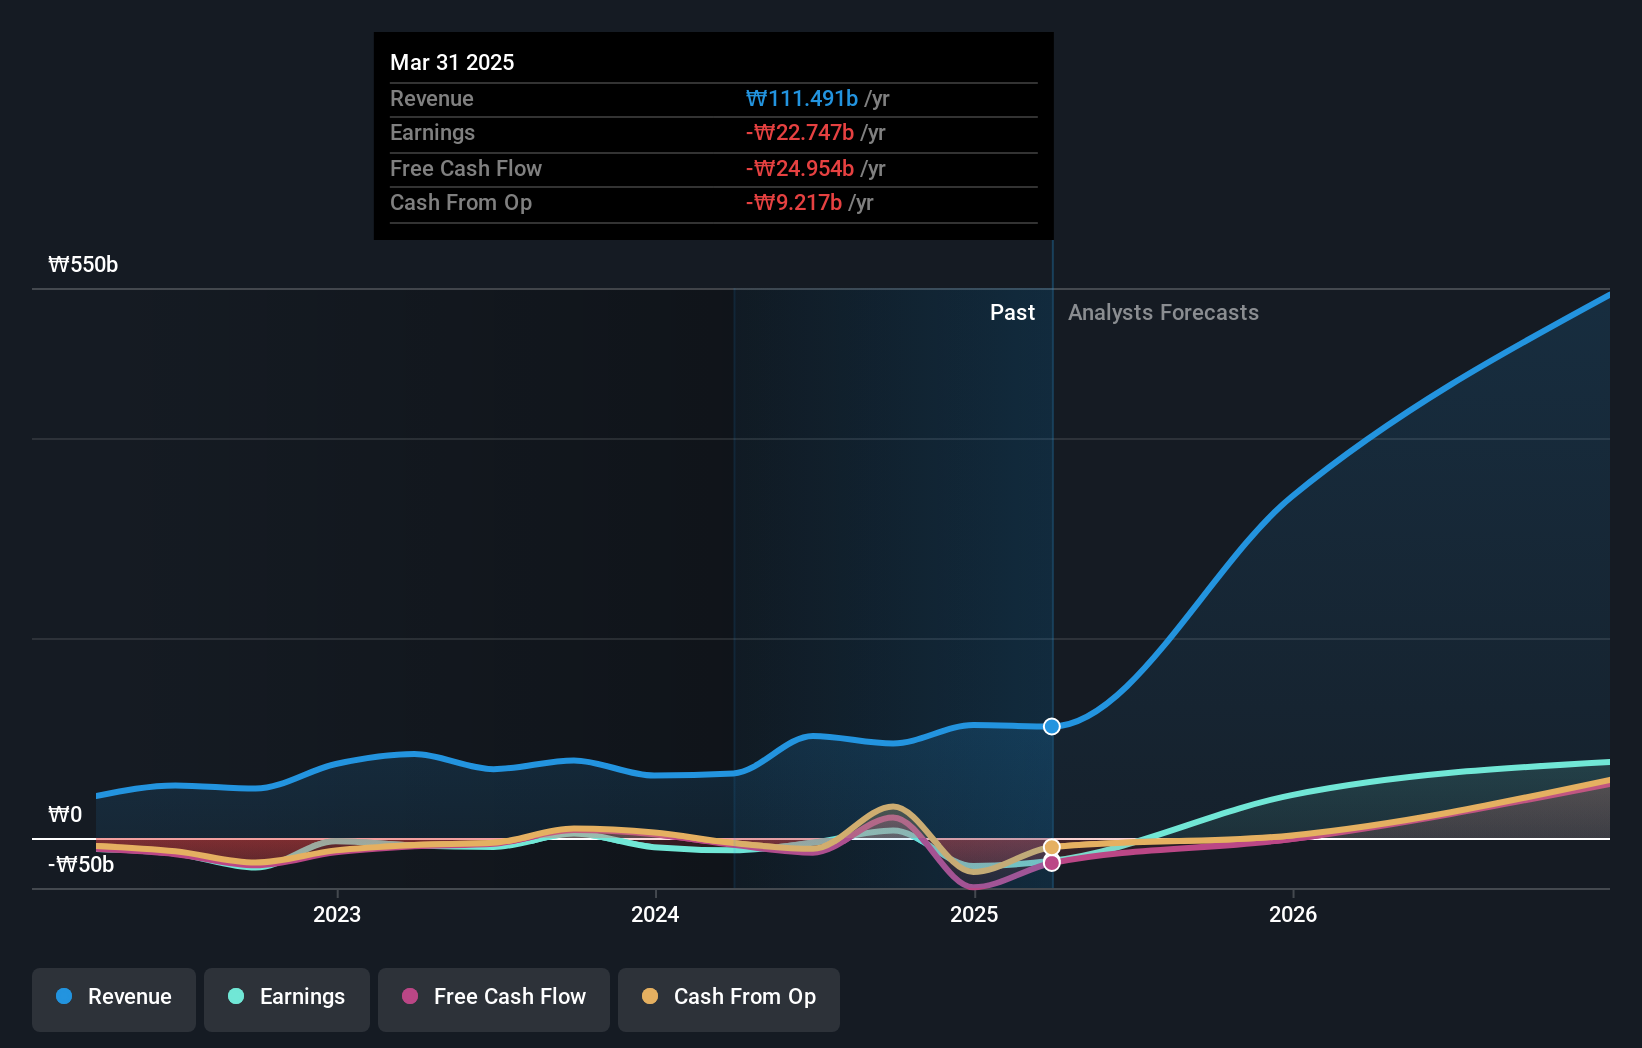
SUNIC SYSTEM, a small player in the semiconductor sector, recently turned profitable, which makes it hard to compare its past earnings growth with the industry's 27.4%. Despite this challenge, it's trading at a solid 33.1% below its estimated fair value. The company has more cash than total debt and boasts high-quality earnings with interest payments well covered by EBIT at 57x coverage. However, its share price has been highly volatile over the last three months. With an expected annual earnings growth of 18.43%, SUNIC SYSTEM offers promising potential for investors looking for value in Asia's tech landscape.
Karmarts (SET:KAMART)
Simply Wall St Value Rating: ★★★★★☆
Overview: Karmarts Public Company Limited, with a market cap of THB9.36 billion, operates in Thailand focusing on the manufacturing, packaging, import, and distribution of cosmetics and consumer products.
Operations: Karmarts generates revenue primarily from the manufacture and distribution of consumer products, contributing THB3.42 billion. Warehouse rental also adds THB27.20 million to its income.
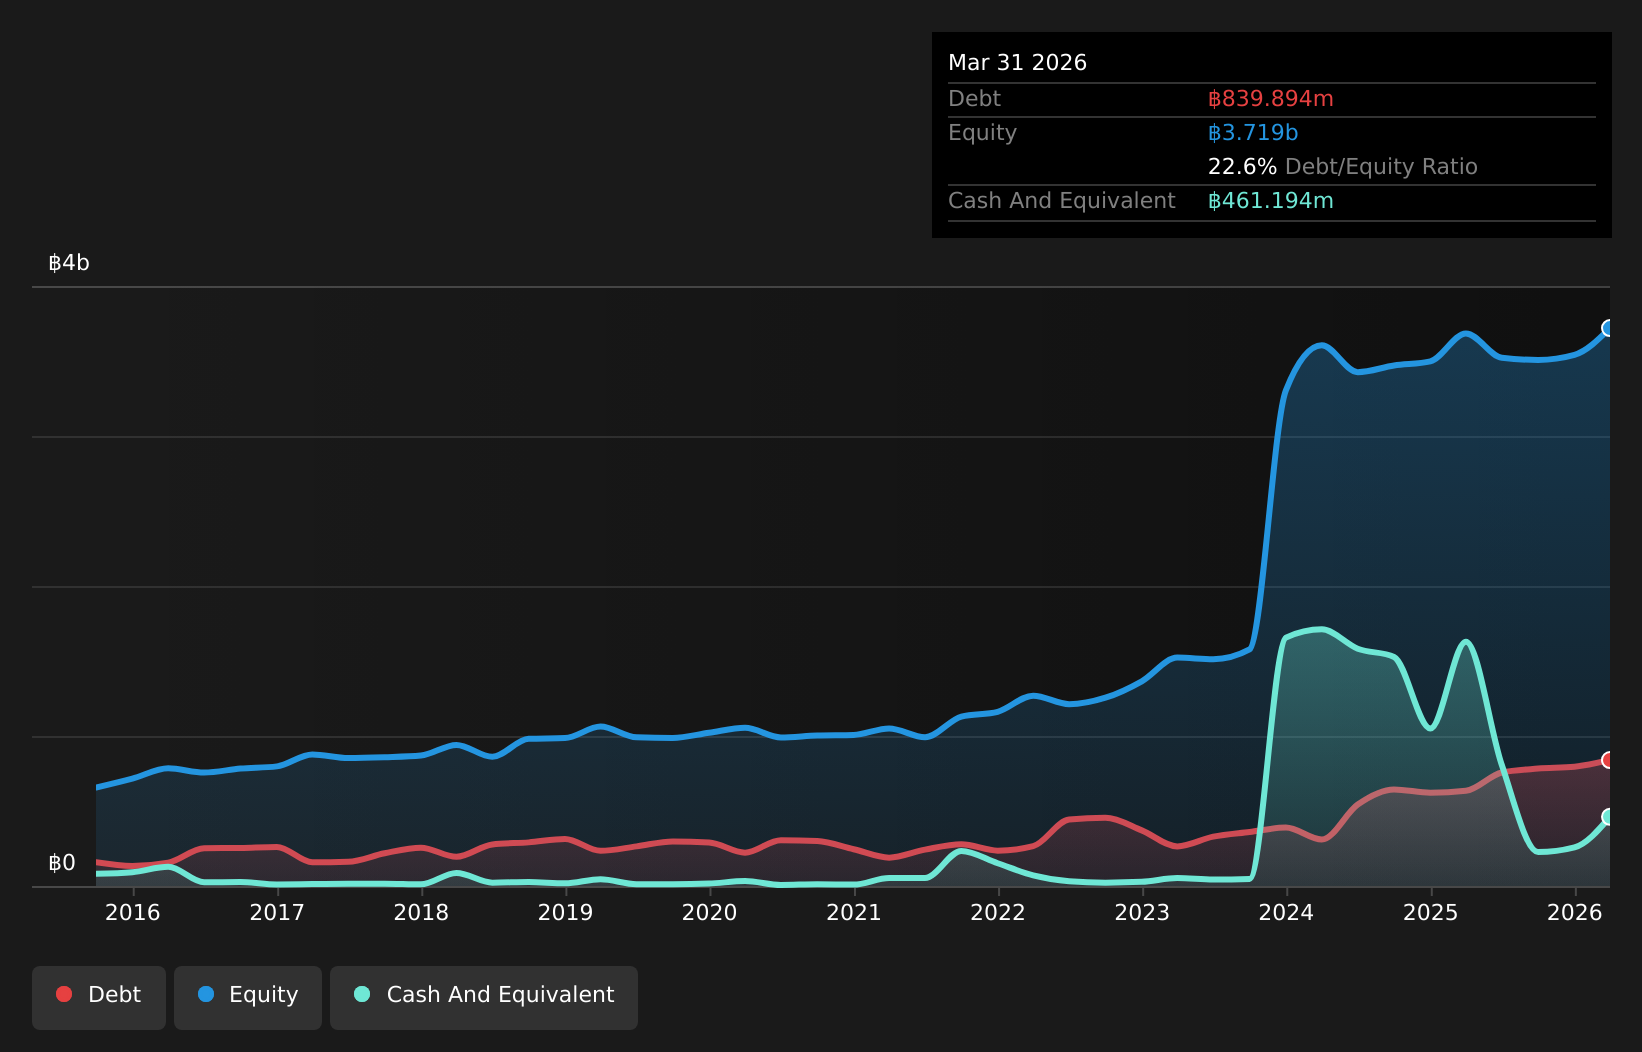
Karmarts, a notable player in the personal products sector, has shown impressive earnings growth of 17.7% over the past year, outpacing the industry average of 6.4%. The company is trading at a good value, with its current price sitting 37.5% below estimated fair value. Despite an increase in debt to equity ratio from 18% to 22.6% over five years, it maintains satisfactory net debt levels at 10.2%. Recent financials reveal sales of THB 893 million and net income of THB 172.6 million for Q1 2026, alongside an interim dividend announcement of THB 0.11 per share payable on June 12th.
- Click here to discover the nuances of Karmarts with our detailed analytical health report.
Gain insights into Karmarts' past trends and performance with our Past report.
Warabeya Nichiyo Holdings (TSE:2918)
Simply Wall St Value Rating: ★★★★☆☆
Overview: Warabeya Nichiyo Holdings Co., Ltd. operates in the manufacture and sale of food products for convenience stores across Japan, the United States, and internationally, with a market capitalization of approximately ¥47.07 billion.
Operations: Warabeya Nichiyo Holdings generates revenue primarily from its Food Products Business, contributing ¥210.67 billion, followed by the Logistics Business at ¥19.64 billion and the Food Materials Businesses at ¥11.57 billion.
Warabeya Nichiyo Holdings, a notable player in the food industry, has demonstrated impressive earnings growth of 76.8% over the past year, significantly outpacing the industry's 10.5%. Despite challenges like a recent fire at its Sapporo Plant, which temporarily halted operations, the company remains resilient with strong financial metrics. Trading at 86.6% below estimated fair value and boasting well-covered interest payments with an EBIT coverage of 6687 times, Warabeya shows robust potential. The debt-to-equity ratio rose from 7.4% to 39.8% over five years but stays within satisfactory limits at a net debt-to-equity ratio of 27.5%.

Key Takeaways
- Discover the full array of 113 Asian Undiscovered Gems With Strong Fundamentals right here.
- Are any of these part of your asset mix? Tap into the analytical power of Simply Wall St's portfolio to get a 360-degree view on how they're shaping up.
- Streamline your investment strategy with Simply Wall St's app for free and benefit from extensive research on stocks across all corners of the world.
Ready For A Different Approach?
- Explore high-performing small cap companies that haven't yet garnered significant analyst attention.
- Fuel your portfolio with companies showing strong growth potential, backed by optimistic outlooks both from analysts and management.
- Find companies with promising cash flow potential yet trading below their fair value.
This article by Simply Wall St is general in nature. We provide commentary based on historical data and analyst forecasts only using an unbiased methodology and our articles are not intended to be financial advice. It does not constitute a recommendation to buy or sell any stock, and does not take account of your objectives, or your financial situation. We aim to bring you long-term focused analysis driven by fundamental data. Note that our analysis may not factor in the latest price-sensitive company announcements or qualitative material. Simply Wall St has no position in any stocks mentioned.
Have feedback on this article? Concerned about the content? Get in touch with us directly. Alternatively, email editorial-team@simplywallst.com