
THOR Industries (THO) Following A Tough Stretch Is The Valuation Now Compelling
Reassessing THOR Industries after prolonged share price weakness
THOR Industries (THO) has faced a tough stretch for shareholders, with the stock down about 24% year to date and about 13% over the past year as of the latest close.
See our latest analysis for THOR Industries.
THOR Industries has shown a short-term rebound, with a 1 day share price return of 3.14% and a 30 day share price return of 4.50%. However, the year to date share price return is still down 24.18% and the 5 year total shareholder return has declined 26.31%. This points to fading longer term momentum as investors reassess growth prospects and risk.
If you are assessing THOR Industries alongside other opportunities in cyclical or consumer focused areas, it can help to broaden your watchlist with companies exposed to long run structural themes such as electrification and automation. One place to start is by looking through 36 robotics and automation stocks
After THOR Industries' recent uptick following a tough run, investors face a choice: commit at today’s price or hold out for a deeper pullback. The next step is to see what the current valuation really implies.
Price-to-Earnings of 15.9x: Is it justified for THOR Industries?
On a simple P/E view, THOR Industries trades on 15.9x earnings, which screens cheaper than the broader US market but richer than the global auto peer group.
The P/E multiple compares the current share price to earnings per share. For a cyclical manufacturer like THOR Industries, it reflects what investors are currently willing to pay for each dollar of earnings from its recreational vehicle and related components business.
Relative to reference points, THOR Industries sits in the middle of the pack. The current P/E of 15.9x is below the US market average of 19.4x and also below an estimated fair P/E of 17.9x, which indicates that the valuation could move higher if earnings forecasts play out. At the same time, the stock trades at a premium to the global auto industry average P/E of 13.5x, which suggests the market is already assigning THOR Industries a higher quality or higher growth profile than many sector peers.
For investors, that combination of a discount to the broader market and peers, yet a premium to the wider auto group, raises a clear question. Is the earnings growth profile and quality of THOR Industries strong enough for the market to push the multiple closer to the estimated fair level, or does the share price settle nearer to the sector average as cyclical sentiment shifts over time? Explore the SWS fair ratio for THOR Industries
Result: Price-to-Earnings of 15.9x (ABOUT RIGHT)
However, THOR Industries still faces risks from its cyclical recreational vehicle demand, and any slowdown in annual revenue or net income growth that challenges current P/E expectations.
Find out about the key risks to this THOR Industries narrative.
Another view on THOR Industries using cash flows
While the P/E ratio suggests THOR Industries is roughly in line with its fair ratio, the SWS DCF model points in a different direction. At a share price of $79.94 and an estimated future cash flow value of $34.07, this approach frames the stock as expensive. Which signal do you treat as more important?
Look into how the SWS DCF model arrives at its fair value.
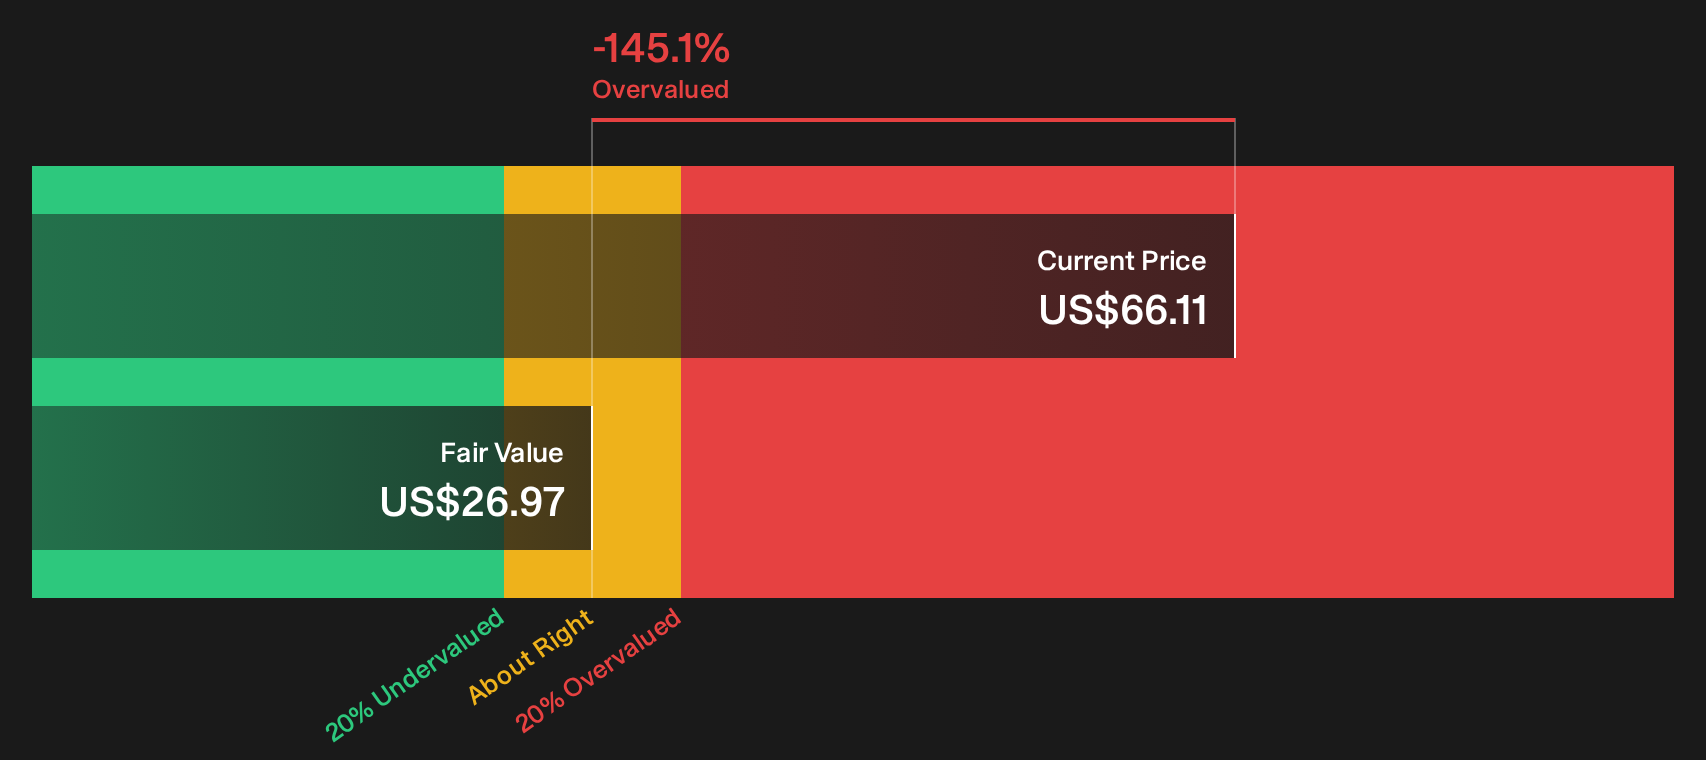
Simply Wall St performs a discounted cash flow (DCF) on every stock in the world every day (check out THOR Industries for example). We show the entire calculation in full. You can track the result in your watchlist or portfolio and be alerted when this changes, or use our stock screener to discover 52 high quality undervalued stocks. If you save a screener we even alert you when new companies match - so you never miss a potential opportunity.
Next Steps
With sentiment mixed around THOR Industries and its valuation signals, it can help to move quickly, study the underlying numbers, and come to your own conclusion. To see what the optimism is based on, review the 4 key rewards.
Looking for more ideas beyond THOR Industries?
If THOR Industries has sharpened your focus on valuation and risk, do not stop here. Broaden your opportunity set and give yourself more options before the next move.
- Spot potential bargains early and stress test your thesis against screener containing 18 high quality undiscovered gems that combine solid fundamentals with under the radar profiles.
- Prioritise resilience by scanning 82 resilient stocks with low risk scores that score well on financial strength and business stability.
- Target quality at a reasonable price by using the solid balance sheet and fundamentals stocks screener (49 results) to filter for companies with healthier balance sheets and cleaner fundamentals.
This article by Simply Wall St is general in nature. We provide commentary based on historical data and analyst forecasts only using an unbiased methodology and our articles are not intended to be financial advice. It does not constitute a recommendation to buy or sell any stock, and does not take account of your objectives, or your financial situation. We aim to bring you long-term focused analysis driven by fundamental data. Note that our analysis may not factor in the latest price-sensitive company announcements or qualitative material. Simply Wall St has no position in any stocks mentioned.
Have feedback on this article? Concerned about the content? Get in touch with us directly. Alternatively, email editorial-team@simplywallst.com