
Asian Growth Leaders With Strong Insider Confidence July 2026
Amidst a backdrop of escalating geopolitical tensions and fluctuating oil prices, Asian markets have shown resilience, with indices like Japan's Nikkei 225 and China's CSI 300 posting gains despite global uncertainties. In such an environment, growth companies with high insider ownership can be particularly appealing as they often indicate strong confidence from those closest to the company's operations.
Top 10 Growth Companies With High Insider Ownership In Asia
| Name | Insider Ownership | Earnings Growth |
| Zhejiang Taotao Vehicles (SZSE:301345) | 27.9% | 31.5% |
| Suzhou Dongshan Precision Manufacturing (SZSE:002384) | 33.5% | 73.1% |
| Shanghai Biren Technology (SEHK:6082) | 11% | 116.9% |
| SEERS (KOSDAQ:A458870) | 33.2% | 41.5% |
| Meiko Electronics (TSE:6787) | 19.2% | 28.0% |
| L&C BIOLTD (KOSDAQ:A290650) | 24% | 148.5% |
| HUMAN MADE (TSE:456A) | 23.9% | 23.4% |
| Gold Circuit Electronics (TWSE:2368) | 30.1% | 38.2% |
| Fulin Precision (SZSE:300432) | 10.4% | 60.7% |
| Biocytogen Pharmaceuticals (Beijing) (SEHK:2315) | 14.1% | 40.4% |
Below we spotlight a couple of our favorites from our exclusive screener.
Hunan Zhongke Electric (SZSE:300035)
Simply Wall St Growth Rating: ★★★★★☆
Overview: Hunan Zhongke Electric Co., Ltd. focuses on the research, development, production, and sales of electromagnetic metallurgy products both in China and internationally, with a market cap of CN¥9.61 billion.
Operations: The company generates revenue through its research, development, production, and sales of electromagnetic metallurgy products domestically and abroad.
Insider Ownership: 14.9%
Revenue Growth Forecast: 22.3% p.a.
Hunan Zhongke Electric is positioned for robust growth with revenue expected to increase by 22.3% annually, outpacing the Chinese market. Earnings are forecast to grow significantly at 41.8% per year, surpassing the market's average growth rate. Despite a lower profit margin compared to last year, its price-to-earnings ratio of 24x suggests good value relative to peers. However, debt coverage remains a concern and dividends are not well supported by free cash flows. Recent shareholder meetings indicate active corporate governance engagement.
- Get an in-depth perspective on Hunan Zhongke Electric's performance by reading our analyst estimates report here.
- Our comprehensive valuation report raises the possibility that Hunan Zhongke Electric is priced lower than what may be justified by its financials.
Money Forward (TSE:3994)
Simply Wall St Growth Rating: ★★★★☆☆
Overview: Money Forward, Inc. offers financial solutions for individuals, financial institutions, and corporations mainly in Japan with a market cap of ¥297.90 billion.
Operations: The company generates revenue through its financial solutions for individuals, financial institutions, and corporations primarily in Japan.
Insider Ownership: 19.2%
Revenue Growth Forecast: 15.4% p.a.
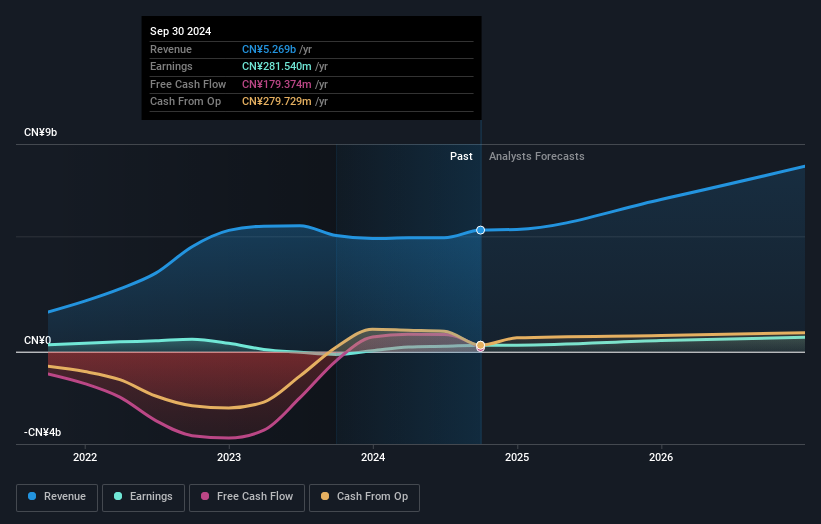
Money Forward's earnings are projected to grow significantly at 37.24% annually, outpacing the Japanese market's average growth rate. Despite recent share price volatility and low forecasted return on equity, its revenue is expected to grow faster than the market at 15.4% per year. The company recently raised its financial guidance due to strong Fintech performance and anticipated sales from investment securities, indicating positive momentum in its business segments despite large one-off items impacting results.
- Delve into the full analysis future growth report here for a deeper understanding of Money Forward.
- The analysis detailed in our Money Forward valuation report hints at an inflated share price compared to its estimated value.
Sansan (TSE:4443)
Simply Wall St Growth Rating: ★★★★★☆
Overview: Sansan, Inc. is a Japanese company that specializes in the planning, development, and selling of cloud-based solutions with a market capitalization of approximately ¥252.41 billion.
Operations: The company's revenue is primarily derived from its Sansan/Bill One Business, which generated ¥46.85 billion, and the Eight Business, contributing ¥6.72 billion.
Insider Ownership: 39.4%
Revenue Growth Forecast: 13.5% p.a.
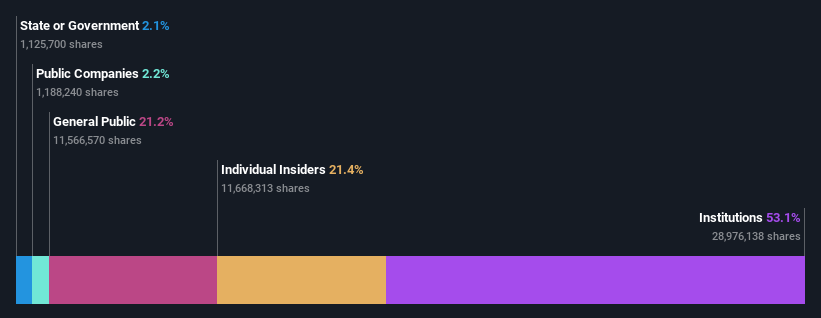
Sansan's earnings are expected to grow significantly at 25% annually, surpassing the Japanese market's average. Recent financial results show substantial profit growth, with net income reaching ¥6.78 billion from ¥424 million a year prior. The company has completed share buybacks worth ¥1.99 billion and announced its first dividend, indicating confidence in future growth and shareholder returns. Despite recent share price volatility, Sansan is trading below its estimated fair value, suggesting potential investment appeal.
- Take a closer look at Sansan's potential here in our earnings growth report.
- Our expertly prepared valuation report Sansan implies its share price may be too high.
Where To Now?
- Gain an insight into the universe of 488 Fast Growing Asian Companies With High Insider Ownership by clicking here.
- Want To Explore Some Alternatives? Rare earth metals are the new gold rush. Find out which 29 stocks are leading the charge.
This article by Simply Wall St is general in nature. We provide commentary based on historical data and analyst forecasts only using an unbiased methodology and our articles are not intended to be financial advice. It does not constitute a recommendation to buy or sell any stock, and does not take account of your objectives, or your financial situation. We aim to bring you long-term focused analysis driven by fundamental data. Note that our analysis may not factor in the latest price-sensitive company announcements or qualitative material. Simply Wall St has no position in any stocks mentioned.The analysis only considers stock directly held by insiders. It does not include indirectly owned stock through other vehicles such as corporate and/or trust entities. All forecast revenue and earnings growth rates quoted are in terms of annualised (per annum) growth rates over 1-3 years.
Have feedback on this article? Concerned about the content? Get in touch with us directly. Alternatively, email editorial-team@simplywallst.com