
Uncovering Undiscovered Gems 3 Promising Stocks to Enhance Your Portfolio
In recent weeks, global markets have been marked by volatility, with major U.S. stock indexes experiencing declines due to concerns over AI investments and rising oil prices, while the S&P MidCap 400 managed a slight gain amid these challenges. In this environment of fluctuating indices and economic uncertainty, identifying promising stocks that can enhance your portfolio involves seeking companies with strong fundamentals and potential for growth despite broader market pressures.
Top 10 Undiscovered Gems With Strong Fundamentals Globally
| Name | Debt To Equity | Revenue Growth | Earnings Growth | Health Rating |
|---|---|---|---|---|
| CNMC Goldmine Holdings | 0.84% | 32.52% | 78.36% | ★★★★★★ |
| DeHua TB New Decoration MaterialLtd | 0.63% | 1.50% | 2.14% | ★★★★★★ |
| Beijing Chunlizhengda Medical Instruments | NA | -2.67% | -10.59% | ★★★★★★ |
| C-Rad | NA | 13.57% | 13.83% | ★★★★★★ |
| GROUPE SFPI | 18.02% | 4.25% | -29.76% | ★★★★★★ |
| Angler Gaming | NA | -5.12% | -24.26% | ★★★★★★ |
| Zhejiang Jolly PharmaceuticalLTD | 21.31% | 17.83% | 29.70% | ★★★★★☆ |
| Sing Investments & Finance | 0.15% | 7.06% | 8.65% | ★★★★☆☆ |
| Shengda ResourcesLtd | 54.08% | 7.99% | 3.75% | ★★★☆☆☆ |
| Kexing Biopharm | 81.10% | 3.69% | 0.01% | ★★★☆☆☆ |
Below we spotlight a couple of our favorites from our exclusive screener.
SpareBank 1 Østlandet (OB:SPOL)
Simply Wall St Value Rating: ★★★★☆☆
Overview: SpareBank 1 Østlandet offers a range of financial products and services to individuals, businesses, and organizations, with a market capitalization of NOK26.02 billion.
Operations: The primary revenue streams for SpareBank 1 Østlandet include its Retail Division, generating NOK3.16 billion, and its Corporate Division, contributing NOK2.17 billion. The net profit margin is a key financial metric to consider when evaluating the company's profitability trends over time.
SpareBank 1 Østlandet, a bank with total assets of NOK215.5B and equity of NOK26.2B, is trading at 43% below its fair value estimate, suggesting potential undervaluation. Despite a high level of bad loans at 2%, the bank's earnings grew by 6.5% over the past year, outpacing industry growth of 3.8%. The institution benefits from low-risk funding sources, with customer deposits comprising 72% of liabilities. Strategic expansions into urban markets like Drammen aim to boost revenue and profit margins through increased demand for housing loans and SME services while digital investments enhance operational efficiency and customer engagement.

Hunan Fangsheng Pharmaceutical (SHSE:603998)
Simply Wall St Value Rating: ★★★★★☆
Overview: Hunan Fangsheng Pharmaceutical Co., Ltd. is involved in the research, development, production, and sale of traditional Chinese medicine and chemical pharmaceutical products in China with a market cap of CN¥3.93 billion.
Operations: The company generates revenue primarily from its traditional Chinese medicine and chemical pharmaceutical product segments. It has reported a net profit margin of 12.5% in the latest period, reflecting its ability to manage costs effectively relative to its revenue streams.
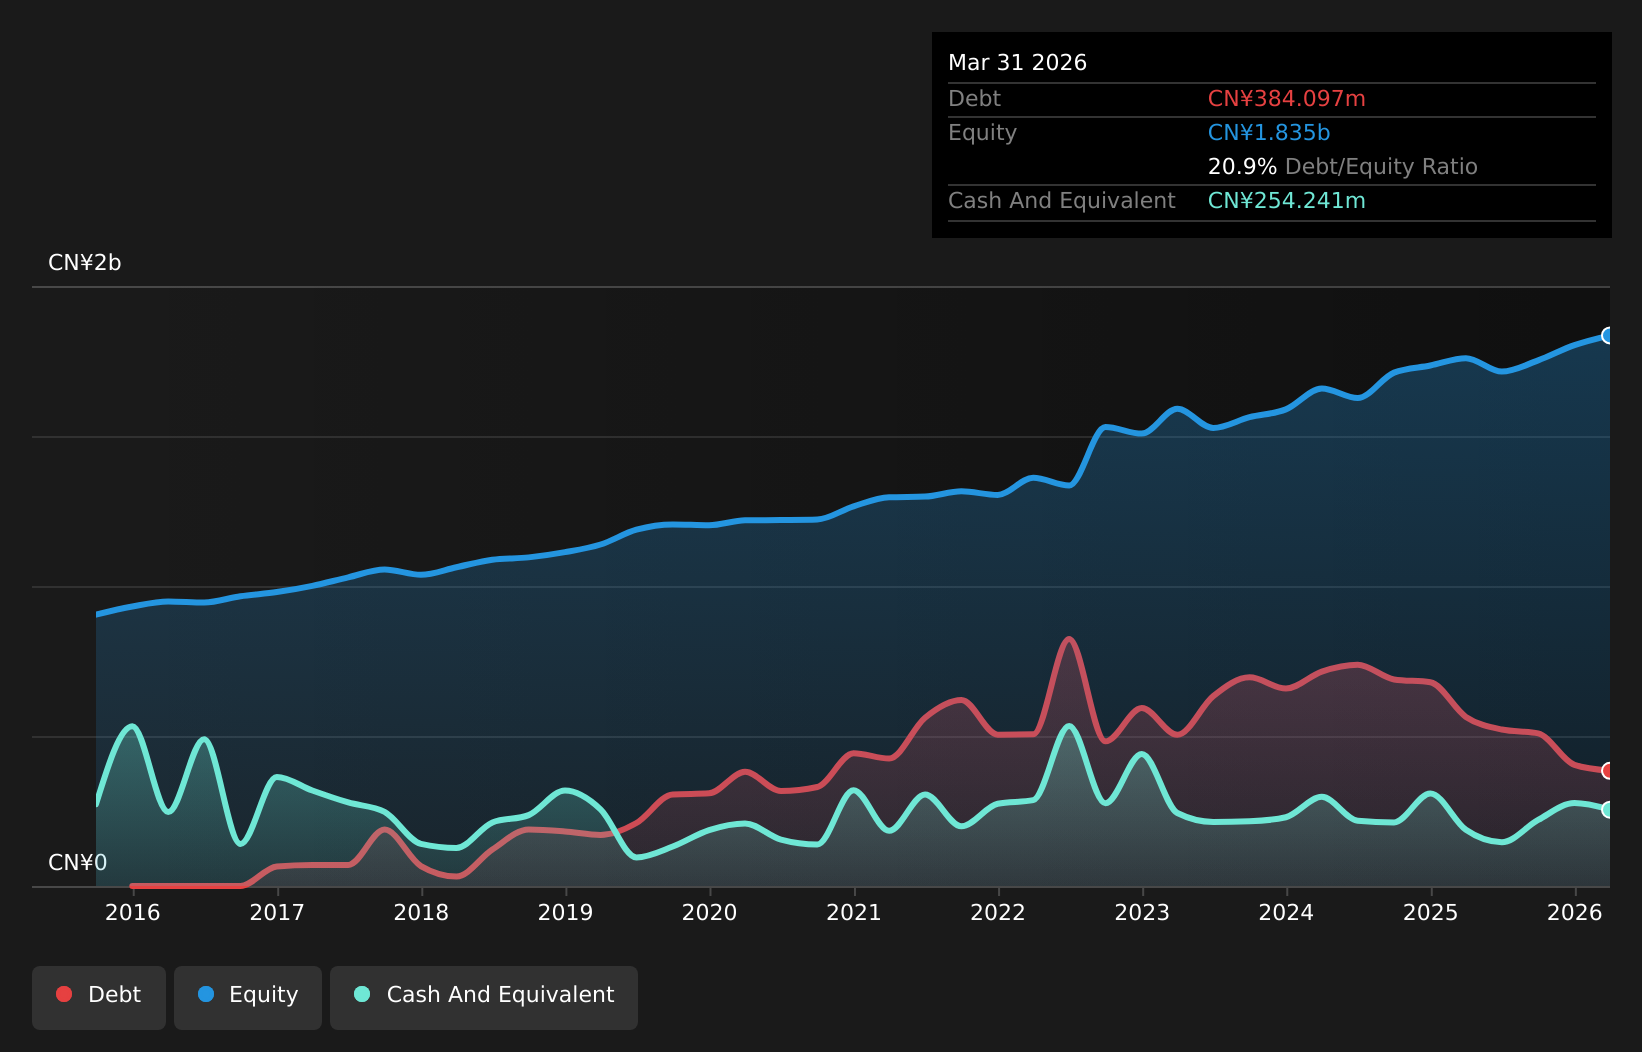
Hunan Fangsheng Pharmaceutical, a smaller player in the pharmaceutical sector, is making waves with its impressive financial health. Its net debt to equity ratio stands at a satisfactory 7.1%, reflecting prudent debt management over the past five years as it reduced from 32.8% to 20.9%. The company's interest payments are comfortably covered by EBIT at an impressive 44 times, showcasing robust earnings quality. With earnings growth of 12.2% last year outpacing the industry average of -1.6%, and trading at nearly 88% below estimated fair value, Hunan Fangsheng seems well-positioned for future growth prospects in its niche market segment.
- Unlock comprehensive insights into our analysis of Hunan Fangsheng Pharmaceutical stock in this health report.
Learn about Hunan Fangsheng Pharmaceutical's historical performance.
Vision (TSE:9416)
Simply Wall St Value Rating: ★★★★★☆
Overview: Vision Inc., along with its subsidiaries, focuses on offering mobile Wi-Fi router rental services both domestically in Japan and internationally, with a market capitalization of approximately ¥48.69 billion.
Operations: Vision Inc. generates revenue primarily from its Global WiFi segment, contributing approximately ¥20.79 billion, and its Information and Communications Service Business, which adds around ¥16.66 billion. The Glamping/Tourism Business accounts for about ¥1.63 billion in revenue.
Vision, a nimble player in its field, is trading at 67.7% below the estimated fair value, presenting an attractive proposition for investors. Over the past year, earnings surged by 31.5%, outpacing the telecom industry's growth of 20.6%. The company recently completed a share buyback of 1.65 million shares for ¥1,706 million to enhance shareholder returns and improve capital efficiency. With a debt-to-equity ratio rising to 8.5% over five years and more cash than total debt, Vision's financial health seems robust despite slight dips in net income from JPY 1 billion to JPY 999 million this quarter compared to last year.
- Delve into the full analysis health report here for a deeper understanding of Vision.
Gain insights into Vision's historical performance by reviewing our past performance report.

Next Steps
- Click this link to deep-dive into the 163 companies within our Global Undiscovered Gems With Strong Fundamentals screener.
- Already own these companies? Bring clarity to your investment decisions by linking up your portfolio with Simply Wall St, where you can monitor all the vital signs of your stocks effortlessly.
- Maximize your investment potential with Simply Wall St, the comprehensive app that offers global market insights for free.
Contemplating Other Strategies?
- Explore high-performing small cap companies that haven't yet garnered significant analyst attention.
- Fuel your portfolio with companies showing strong growth potential, backed by optimistic outlooks both from analysts and management.
- Find companies with promising cash flow potential yet trading below their fair value.
This article by Simply Wall St is general in nature. We provide commentary based on historical data and analyst forecasts only using an unbiased methodology and our articles are not intended to be financial advice. It does not constitute a recommendation to buy or sell any stock, and does not take account of your objectives, or your financial situation. We aim to bring you long-term focused analysis driven by fundamental data. Note that our analysis may not factor in the latest price-sensitive company announcements or qualitative material. Simply Wall St has no position in any stocks mentioned.
Have feedback on this article? Concerned about the content? Get in touch with us directly. Alternatively, email editorial-team@simplywallst.com