
China Index Research Institute: Office rents in key cities fell 0.48% month-on-month in the second quarter, with a cumulative decrease of 1.01% in the first half of the year
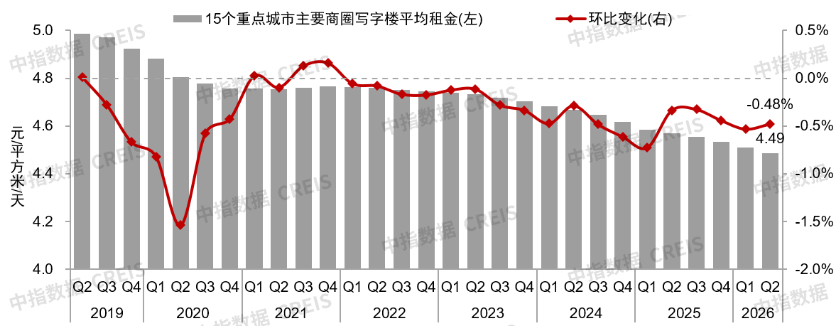
The Zhitong Finance App learned that the China Index Research Institute published an article stating that according to the survey data of office rental samples in major business districts in key cities in China's key cities, in the second quarter of 2026, the average rent for office buildings in major business districts in key cities across the country was 4.49 yuan/m2/day, down 0.48% month-on-month, with a cumulative decrease of 1.01% in the first half of the year. Judging from the performance of different business districts, there were 66 business districts where office rents fell month-on-month in the second quarter, accounting for 82.5%; rents in 12 business districts rose month-on-month, accounting for 15%; and rents in 2 business districts remained flat month-on-month, accounting for 2.5%.
Looking at the macro environment of the industry, in the first half of 2026, China's GDP reached 69.6 trillion yuan, an increase of 4.7% over the previous year. Economic growth momentum has been weak since the second quarter. In terms of consumption, the country's total retail sales of social consumer goods increased 1.3% year-on-year in the first half of 2026, down 1.1 percentage points from the first quarter. In terms of investment, the country's fixed asset investment (excluding rural households) fell 5.7% year on year in the first half of 2026. The cumulative growth rate turned negative in April, and investment in real estate development fell 18% year on year, causing a drag on investment. Exports remained resilient. Total exports (in RMB) increased 13.4% year-on-year in the first half of 2026, 1.5 percentage points faster than in the first quarter.
The development of new quality productivity has driven the service economy to maintain rapid growth, yet most enterprises still have insufficient momentum to expand. In the first half of 2026, the value added of the service sector increased by 5.2% year on year, 0.5 percentage points higher than the GDP growth rate. New productivity such as artificial intelligence boomed, driving the value added of information transmission, software and information technology services. The value added of the leasing and business services industries increased by 10.7% and 11.9% year on year, respectively. However, the expansion momentum of most service companies is still weak, and the average index of business activity in the service sector in the first half of the year was only 50.0%.
Overall, in the first half of 2026, the Chinese economy continued to operate smoothly, supported by continued strength in macroeconomic policies and the resilience of external demand, and the leading role of new momentum continued to increase. However, uncertainty in the current external environment is rising, domestic demand recovery is slow, the foundation for a positive economic recovery still needs to be consolidated, and the operating pressure on some enterprises is still high. The office market continues to be characterized by overall pressure and partial improvement. Rents in business districts and urban core business districts where a small number of technology companies are concentrated have stabilized, but the trend of oversupply and demand in most business districts is still severe. Vacancies are under pressure, and rents are declining.
1. Rent performance: Office rents in key cities fell 0.48% month-on-month in the second quarter of 2026, with a cumulative decrease of 1.01% in the first half of the year
Figure: Average office rents and month-on-month changes in major business districts in key cities across the country from 2019 to 2026
Data source: China Real Estate Index System
In the first half of 2026, demand in the office market in key cities continued to diverge. The development of the technology industry represented by artificial intelligence has led to the release of leasing demand from related enterprises, but demand in traditional industries is weak, and enterprise site selection is still mainly based on relocation and lease renewal. In terms of rent, most landlords are still stabilizing rental rates through flexible leases, rent discounts, etc., and rents in the office market in key cities continue to decline. According to survey data of office rental samples in major business districts in key cities across the country, in the second quarter of 2026, the average rent for office buildings in major business districts in key cities across the country was 4.49 yuan/m2/day, down 0.48% month-on-month, with a cumulative decrease of 1.01% in the first half of the year.
2. Business district performance: Over 80% monitored a month-on-month decline in commercial district rents, with business districts such as Haikou Guoxing and Chongqing Jiangbeizui falling relatively large
In the second quarter of 2026, in the first-tier city sample, 83.3% of commercial district office rents fell month-on-month, 13.9% of commercial district office rents rose month-on-month, and 2.8% of commercial district office rents remained flat month-on-month. In the second-tier city sample, 81.8% of commercial district office rents fell month-on-month, 15.9% of business-district office rents rose month-on-month, and 2.3% of business-district office rents remained flat month-on-month.
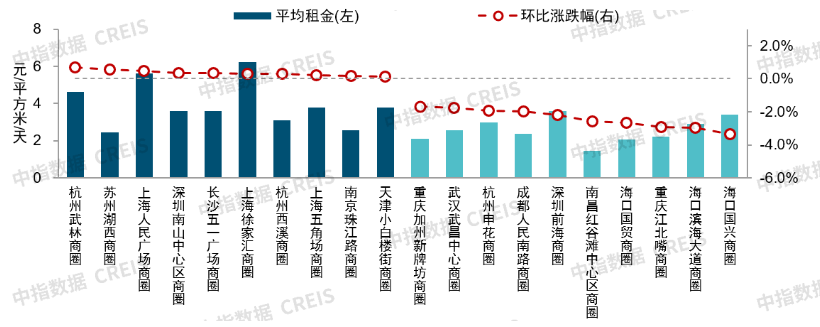
Figure: Business districts with large month-on-month increases and decreases in office rents in the second quarter of 2026
Data source: China Real Estate Index System
In the second quarter of 2026, office rents in the 66 sample business districts fell month-on-month, accounting for 82.5%, and the number increased by 4 compared to the first quarter. Among them, rents in 6 business districts including Haikou Guoxing and Chongqing Jiangbeizui fell more than 2.0% month-on-month; rents in 12 business districts including Chengdu Renmin South Road, Hangzhou Shenhua, Wuhan Wuchang Center, and Chongqing California Xinpaifang fell between 1.0%-2.0%, while 20 commercial districts including Beijing Financial Street, Shanghai Nanjing East Road, Qingdao Haier Road, and Shanghai Lujiazui were between 0.5%-1.0%. The ratio decline was between 0.1%-0.5%, Futian Central District, Shenzhen, and Qingdao Rents in eight business districts, including the Mountain Government, stabilized, falling within 0.1%.
At the same time, office rents in a few business districts also rose month-on-month. Specifically, rents in Hangzhou's Wulin business district saw the biggest month-on-month increase of 0.69%; Suzhou's Huxi business district rose 0.56% month-on-month, while rents in 10 business districts including Shanghai People's Square, Shenzhen Nanshan Central Area, Changsha Wuyi Square, and Shanghai Xujiahui rose less than 0.5% month-on-month. Furthermore, rents in Guangzhou's Tianhebei and Tianjin Youyi Road business districts remained flat month-on-month.
3. Rent trends: Rents in business districts where a small number of technology companies are concentrated are expected to stabilize first, but the overall trend of oversupply in the market is difficult to change, and rents in most business districts may continue to decline
In the year the “15th Five-Year Plan” began, the macroeconomy focused on the construction of a modern industrial system and the development of new quality productivity with the theme of high-quality development. Emerging pillar industries such as integrated circuits, aerospace, biomedicine, low-altitude economy, new energy storage, and intelligent robots are developing well. The “Artificial Intelligence +” campaign accelerates the large-scale commercial application of AI in key industries. The new leasing, lease expansion, and relocation needs of related enterprises provide some support to the office market, but it is not enough to reverse the serious trend of overall supply exceeding demand in the market. At the same time, the development of the artificial intelligence industry may cause some enterprises to shrink employment in the short term or through job substitution, leading to a rebound in demand for office leasing in some regions.
Looking ahead to the second half of the year, competition in the office market in some business districts may further intensify as new supplies enter the market. On the demand side, technology companies are expected to continue their expansion trend, thereby releasing more demand for office leasing, but most companies are willing to expand or are still cautious, and it is expected that office costs will still be reduced through relocation and lowering renewal prices. In terms of rents, rents for high-quality buildings in core business districts where technology companies are concentrated are expected to take the lead in stabilizing, and office rents in most business districts may continue to decline.
Office market performance in key cities
1. Demand trend: The vacancy rate of office buildings in nearly half of the cities has increased, and the TMT industry has relatively high rental demand
1) Vacancy rate: Cities such as Wuhan and Changsha are under high vacancy pressure, while the vacancy rate in cities such as Guangzhou and Chengdu increased compared to the end of the previous year
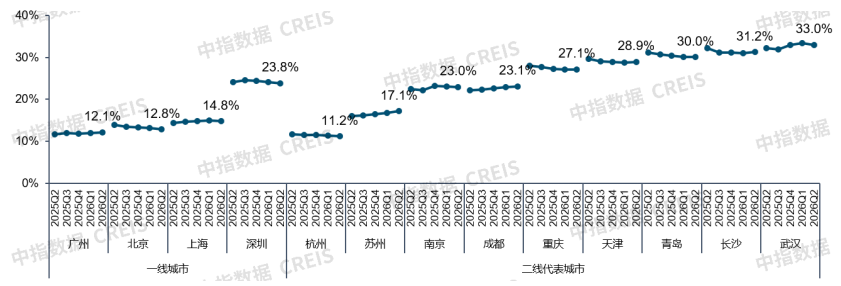
Figure: Vacancy rate of Grade A office buildings in key cities from the second quarter of 2025 to the second quarter of 2026
Data source: Middle Index Data CREIS
In the first half of 2026, new supply of office buildings in key cities continued to be released, demand recovery was slow, and vacancy pressure increased in some cities. According to data from the China Index, in the second quarter of 2026, the vacancy rate of Class A office buildings in first-tier cities was relatively low, with Guangzhou being the lowest, at 12.1%; among second-tier representative cities, Hangzhou and Suzhou had vacancy rates of Class A office buildings within 20%, and market supply and demand were relatively balanced. The vacancy rate of Grade A office buildings in cities such as Qingdao, Changsha, and Wuhan was relatively high, and vacancy pressure was relatively high. Judging from changes in vacancy rates, in the second quarter of 2026, the vacancy rate of Grade A office buildings in cities such as Guangzhou, Suzhou, Chengdu, Tianjin, Changsha, and Wuhan all increased compared to the end of the previous year.
2) Rental cases: The TMT industry is in relatively high demand, and the proportion of leasing cases above 5,000 square meters has increased
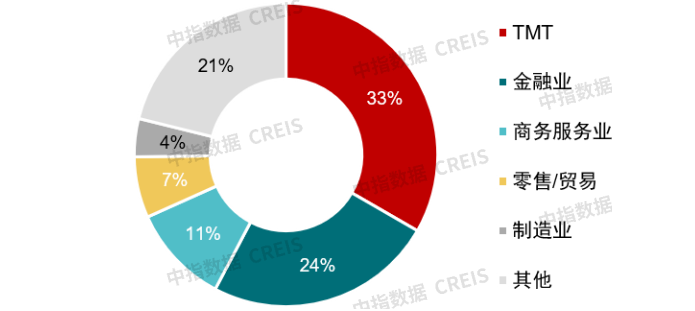
Figure: The first half of 2026 represents the share of the tenant industry in urban office leasing transactions
Data source: Middle Index Data CREIS
In the first half of 2026, the China Index data detected a total of 123 cases of large-scale leasing of office buildings. Among them, the TMT industry, finance industry, and business services industry still had high rental demand, accounting for nearly 70% of total leasing cases. Specifically, the TMT industry detected 41 cases, accounting for 33%, an increase of 15 percentage points over the same period last year; the financial industry and business services industry detected 30 cases and 13 cases respectively, accounting for 24% and 11% respectively; all other industries monitored less than 10 cases, accounting for a total of about 32%.
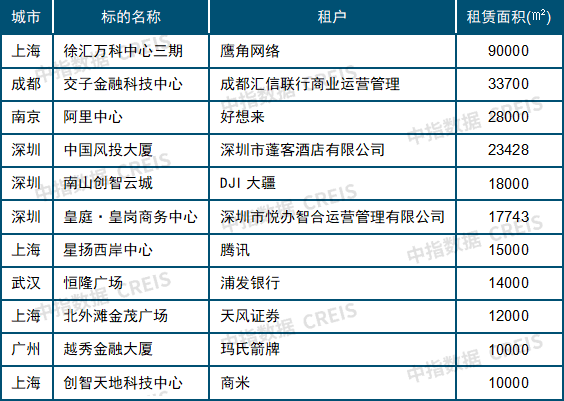
Looking at the area segment, in the first half of 2026, there were 32 monitoring cases with a leased area of 5,000 square meters or more, accounting for 26%, an increase of 12.1 percentage points over the same period last year. Tenants were mostly located in the financial industry and TMT industry.
Table: Major leasing cases in key cities in the first half of 2026 (partial)
Data source: Middle Index Data CREIS
2. Bulk transactions: Market activity has increased compared to the same period last year, and institutional investors are still concerned about commercial assets in core cities
In the first half of 2026, activity in China's bulk trading market increased compared to the same period last year. In the first half of 2026, the China Index data detected a total of 117 large transactions*, an increase of 16 over the same period last year. Among them, the number of transactions involving first-tier cities was 57, with Shanghai being the most concentrated, with 28; Shenzhen and Beijing both had more than 10 transactions, and Guangzhou had only 4. The number of transactions involving second-tier cities was 33, with Chongqing having the highest number of transactions, with 4; 7 cities including Suzhou, Hefei, and Wuhan had 2-3 transactions, and 9 cities including Urumqi, Kunming, and Shijiazhuang each had 1 transaction. The number of transactions involving third- and fourth-tier cities was 28. The cities where transactions occurred include more than 20 cities including Zhuhai, Jinhua, and Jiaxing.
* The property types of assets subject to major transactions counted in this report include office buildings, businesses, hotels, complexes, industrial plants, industrial parks, apartments, etc., excluding land plots and residences. Furthermore, transactions with a transaction amount of up to 100 million yuan are not included, and transactions arising from non-market-based acts such as related transactions are not included. Some asset package transactions include assets distributed in different cities, so there are repeated calculations when counting the number of transactions by city.
In the first half of 2026, based on transactions that disclosed the transaction amount, the China Index data detected a total of 59.9 billion yuan in bulk transactions. Among them, the transaction amount for first-tier cities was about 46 billion yuan, the transaction amount for Shanghai exceeded 27 billion yuan, the transaction amount for Beijing and Shenzhen was 12 billion yuan and 5.6 billion yuan respectively, and Guangzhou was about 800 million yuan. The transaction amount in second-tier cities is about 8 billion yuan, and the transaction amount in Hefei exceeds 1 billion yuan; the transaction amount of Wuhan, Qingdao, Chongqing, Tianjin, Hangzhou, and Xi'an is between 500 and 1 billion yuan. The transaction amount for third- and fourth-tier cities was 5.4 billion yuan, of which Zhuhai had the highest transaction amount of 950 million yuan.
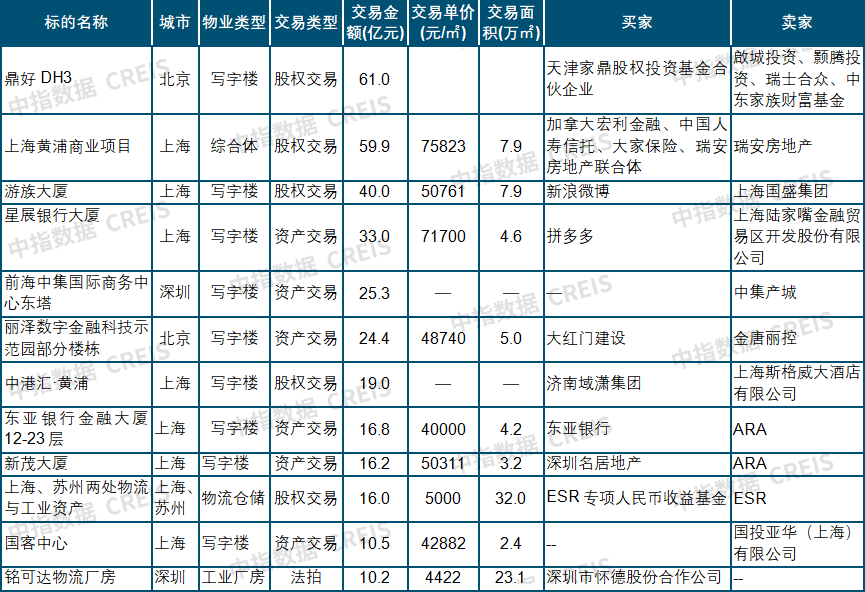
Table: Major transaction cases in key cities in the first half of 2026 (partial)
Data source: Middle Index Data CREIS
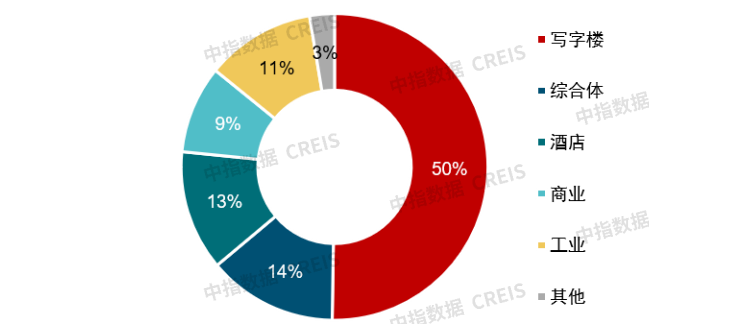
Figure: Share of major transactions in key cities in the first half of 2026 (by property type)
Data source: Middle Index Data CREIS
By property type, high-quality retail commercial and office properties account for over 70% of the transaction amount. Judging from the number of transactions, in the first half of 2026, there were 55 transactions targeting retail businesses, office buildings, and complexes, accounting for a total of nearly 50%. Based on the disclosed transaction amount, the transaction amount for office buildings was relatively high, at 30.1 billion yuan, accounting for 50%; the amount of complex and retail transactions was 8.2 billion yuan and 5.5 billion yuan respectively, accounting for 23% in total. The transaction amounts for hotels and industrial assets were 7.6 billion yuan and 6.9 billion yuan respectively, accounting for about 12%, while other types of transactions amounted to about 1.6 billion yuan, accounting for 3%.
Judging from the characteristics of buyers, institutional investors and real estate-related companies have larger transaction amounts. In the first half of 2026, based on disclosing buyers' transactions, local state-owned enterprises, institutional investors, technology companies, and manufacturing companies were relatively active in mergers and acquisitions, accounting for nearly 60% of the total number of transactions; based on total transactions, buyers as institutional investors accounted for about 30% of the transaction amount. Judging from the characteristics of sellers, housing enterprises are still the main sellers in the bulk exchange market. Based on the disclosure of sellers' transactions, domestic and foreign real estate-related enterprises account for nearly 60% of transactions; based on total transactions, the transaction amount accounts for more than 60%.
Looking ahead to the second half of the year, there is still room for bargaining for assets, and institutional investors and corporate buyers are expected to remain active. Currently, asset exit channels are becoming more and more diverse. Institutional investors may continue to pay attention to the core location of high-energy cities, high-quality assets with stable rent returns, and old properties and non-performing assets that are in line with the urban renewal orientation and have room for renovation. For corporate buyers, the development of industries such as artificial intelligence and high-end manufacturing will spawn more demand for office space, and the demand for enterprises to buy their own office buildings will still be an important support for the bulk trading market.