
3 Penny Stocks In Global With Market Caps Up To US$900M
As global markets navigate a period of volatility, marked by declining tech stocks and fluctuating oil prices, investors are increasingly looking for opportunities beyond the large-cap landscape. Penny stocks, often associated with smaller or newer companies, remain an intriguing option for those willing to explore lesser-known segments of the market. While the term might seem outdated, these stocks can offer substantial growth potential when backed by solid financials and strong fundamentals.
We'll examine a selection from our screener results.
Stars Microelectronics (Thailand) (SET:SMT)
Simply Wall St Financial Health Rating: ★★★★★★
Overview: Stars Microelectronics (Thailand) Public Company Limited manufactures and distributes integrated circuit boards in Thailand, the United States, and internationally, with a market cap of THB3.90 billion.
Operations: Stars Microelectronics (Thailand) generates revenue from three main segments: Fiber Optics Devices at THB628 million, Outsourced Assembly and Test at THB578 million, and Electronics Manufacturing Service contributing THB983 million.
Market Cap: THB3.9B
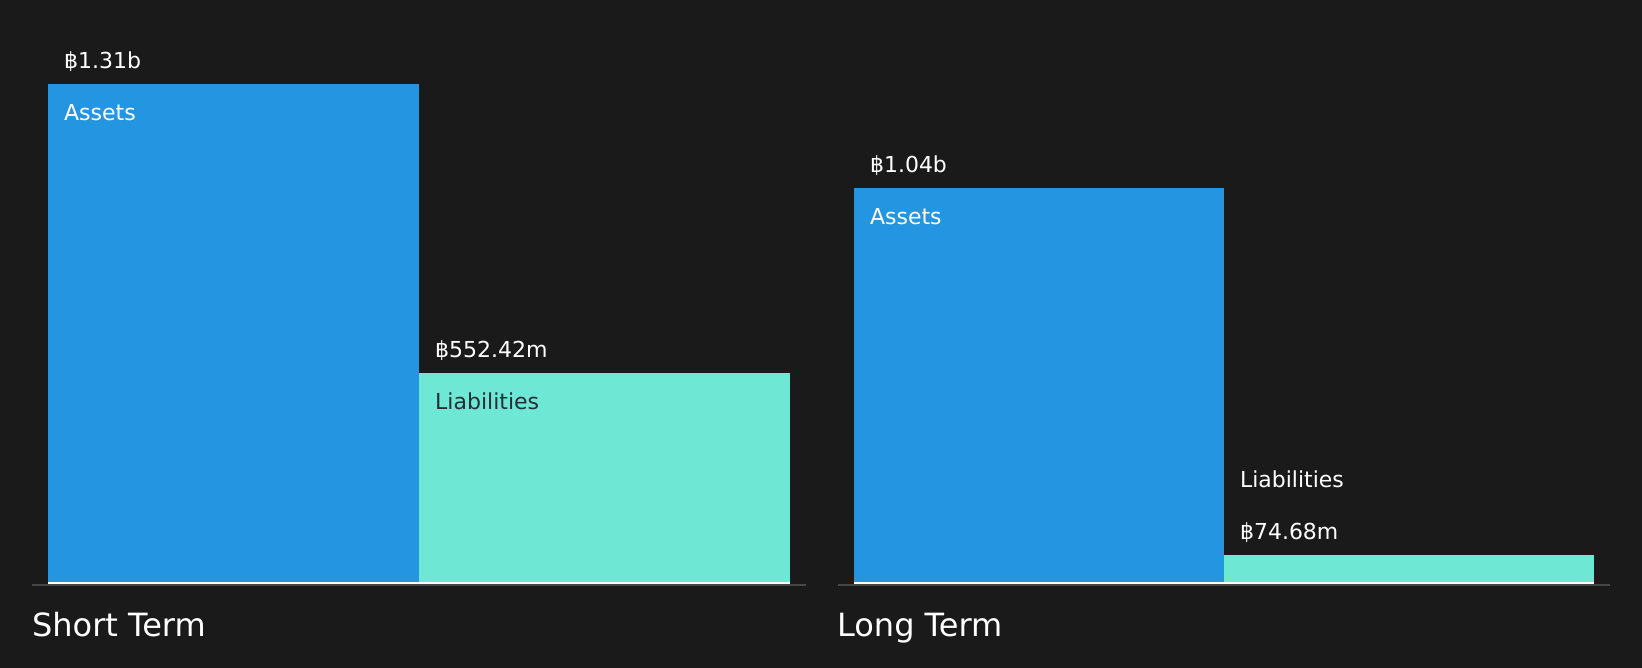
Stars Microelectronics (Thailand) operates without debt, which alleviates concerns over interest payments and enhances its financial stability. Despite being unprofitable with a negative return on equity of -5.38%, the company maintains strong short-term asset coverage over liabilities, with THB1.3 billion in assets against THB552.4 million in liabilities. Recent strategic alliances have bolstered its Outsourced Semiconductor Assembly and Test capabilities, marking a significant step forward as the G1 facility begins commercial production. However, increased share price volatility and recent executive changes could pose challenges to investor confidence amidst ongoing efforts to stabilize operations and improve profitability.
- Dive into the specifics of Stars Microelectronics (Thailand) here with our thorough balance sheet health report.
- Review our historical performance report to gain insights into Stars Microelectronics (Thailand)'s track record.
Jiangsu Yinhe ElectronicsLtd (SZSE:002519)
Simply Wall St Financial Health Rating: ★★★★★★
Overview: Jiangsu Yinhe Electronics Co., Ltd. manufactures and sells computer, communication, and other electronic equipment both in China and internationally, with a market capitalization of CN¥5.65 billion.
Operations: Jiangsu Yinhe Electronics Co., Ltd. has not reported specific revenue segments.
Market Cap: CN¥5.65B
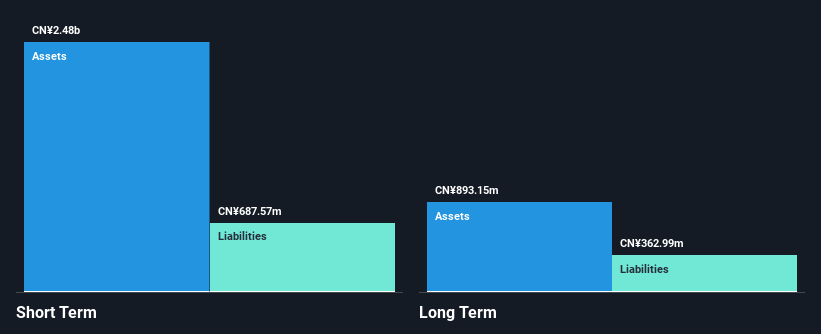
Jiangsu Yinhe Electronics Co., Ltd. has shown improvement in its financial performance, reporting first-quarter sales of CN¥224.44 million, up from CN¥87.9 million the previous year, and achieving a net income of CN¥1.6 million compared to a net loss previously. Despite this progress, the company remains unprofitable with a negative return on equity of -2.99%. However, it benefits from strong short-term asset coverage over liabilities (CN¥2.6 billion vs CN¥778.6 million) and is debt-free, providing some financial stability amidst ongoing efforts to enhance profitability and reduce cash outflows sustainably over time.
- Get an in-depth perspective on Jiangsu Yinhe ElectronicsLtd's performance by reading our balance sheet health report here.
- Explore historical data to track Jiangsu Yinhe ElectronicsLtd's performance over time in our past results report.
Fuchun Technology (SZSE:300299)
Simply Wall St Financial Health Rating: ★★★★☆☆
Overview: Fuchun Technology Co., Ltd. is engaged in the development and publication of mobile games across China, Hong Kong, Macau, Taiwan, and internationally with a market cap of CN¥3.44 billion.
Operations: No specific revenue segments have been reported for this company.
Market Cap: CN¥3.44B
Fuchun Technology Co., Ltd. has demonstrated revenue growth with first-quarter sales reaching CN¥102.69 million, up from CN¥83.42 million the previous year, and a net income of CN¥12.21 million compared to CN¥10.1 million previously, indicating some operational improvement despite being unprofitable overall with a negative return on equity of -22.9%. The company maintains a sufficient cash runway for over three years even as free cash flow shrinks by 23.4% annually, and it has reduced its debt-to-equity ratio from 72.9% to 63.4% over five years, though short-term liabilities slightly exceed assets (CN¥404.7M vs CN¥391.1M).
- Jump into the full analysis health report here for a deeper understanding of Fuchun Technology.
- Assess Fuchun Technology's previous results with our detailed historical performance reports.
Seize The Opportunity
- Click this link to deep-dive into the 3,674 companies within our Global Penny Stocks screener.
- Curious About Other Options? The best AI stocks today may lie beyond giants like Nvidia and Microsoft. Find the next big opportunity with these 16 smaller AI-focused companies with strong growth potential through early-stage innovation in machine learning, automation, and data intelligence that could fund your retirement.
This article by Simply Wall St is general in nature. We provide commentary based on historical data and analyst forecasts only using an unbiased methodology and our articles are not intended to be financial advice. It does not constitute a recommendation to buy or sell any stock, and does not take account of your objectives, or your financial situation. We aim to bring you long-term focused analysis driven by fundamental data. Note that our analysis may not factor in the latest price-sensitive company announcements or qualitative material. Simply Wall St has no position in any stocks mentioned.
Have feedback on this article? Concerned about the content? Get in touch with us directly. Alternatively, email editorial-team@simplywallst.com