
Kerui: It is expected that the promotion enthusiasm of core Tier 1 and 2 cities will remain weak in the second half of the year, and Tier 2 and 3 cities will shift to stock elimination
The Zhitong Finance App learned that Kerry Real Estate Research shows that in the first half of 2026, total commercial residential inventories in the 50 key cities showed a downward trend for several consecutive quarters, but the elimination cycle did not decline but instead rose. By the end of June 2026, the total inventory of commercial housing in the country's 50 key cities was about 300 million square meters, down about 7.3% year on year, down about 23.3% from about 390 million square meters at the beginning of 2023, falling back to a three-year low; however, the removal cycle was still in the high range of 26.1 months, up 7.3 months from 18.8 months in January 2023. Looking ahead to the second half of the year, the supply side will continue the strategy of “determining production by sales”. The active promotion of core tier 1 and 2 cities is expected to be maintained, and weak second- and third-tier cities will further shrink and shift to stock removal; the policy side will continue to focus on “controlling growth, removing stocks, and improving supply,” and both supply and demand sides will work together to clear the market. However, in the end, substantial improvements in the elimination cycle will still depend on the reversal of residents' home purchase expectations and substantial restoration on the demand side.
1. Passive inventory removal dominates: the truth about elimination under asymmetric supply and demand contraction
Judging from the operating logic of the industry, the prudent management strategy of “determining production by sales and investment by sales” continues to deepen, and land purchases and willingness to start new construction remain low. In the first half of 2026, the country's new residential construction area fell by about 24.1% year on year. Active contraction on the supply side is a necessary process for the industry to absorb historical inventories and restructure the balance between supply and demand.
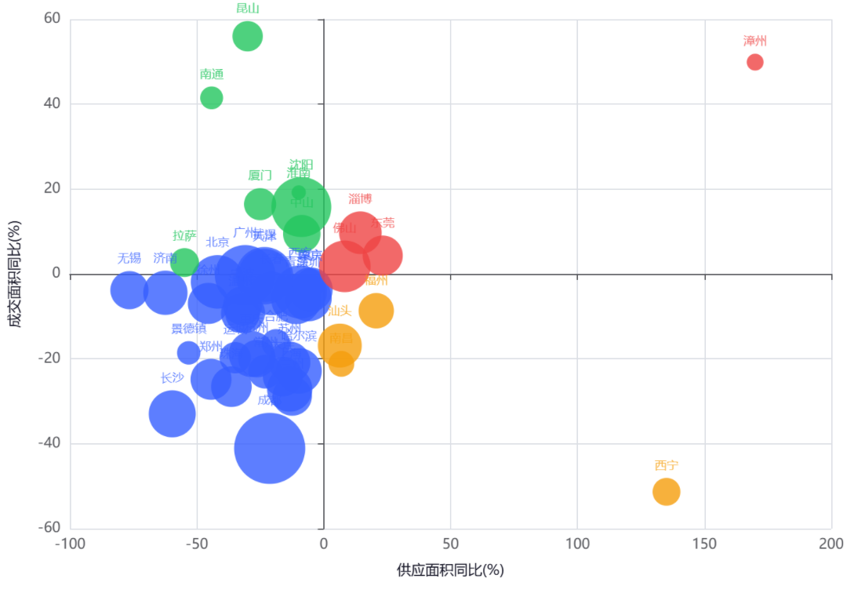
Judging from the supply and demand change structure of the 50 key cities, the core characteristic of the current market is asymmetric supply and demand doubling: the supply-side contraction slope is significantly higher than at the transaction end, which determines that most cities are still in the supply-driven passive inventory removal stage. According to the data, there were 15 cities where supply fell by more than 30% year on year in the first half of the year. Among them, the supply scale of cities such as Wuxi, Jinan, Changsha, Lhasa, and Jingdezhen almost “dropped”, while the drop in Wuxi reached 76.55%. The contraction at the transaction end was relatively moderate. Jinan transactions fell slightly by 4.44% year on year, Wuxi fell by 3.82%, and Wuhan fell by only 0.41%. Supply was drastically reduced and transactions remained basically flat, so a drop in total inventory was inevitable.
However, there is a clear boundary in effectiveness of this “market-based production” passive inventory removal. When the compressible space for incremental supply continues to narrow, the marginal effects of supply contraction gradually diminish, and the transaction end fails to achieve trend repair, the upward trend in the decontamination cycle is irreversible. Typical example is Harbin, where supply fell 9.75% year on year, but the transaction drop reached 22.85%, and the accelerated contraction on the demand side directly contributed to a sharp expansion of 11.01 months; Chengdu's performance was more outstanding, with supply falling 21.29% year on year, but transactions plummeted by 41.1%. The scissor gap between supply and demand continued to widen, driving inventories to rise 7.57% year on year, and the removal cycle lengthened by 14.06 months.
Figure 1 Quadrant analysis of supply and demand changes in 50 key cities in the first half of 2026
Data source: CRIC China Real Estate Decision Consulting System
In summary, “inventory removal” in most cities today is essentially a supply-side driven passive clearance, and its sustainability is highly dependent on substantial repair at the transaction end. In a context where demand expectations have not been fundamentally reversed, the effectiveness of passive inventory removal is rapidly declining, and the continued rise in the removal cycle is a concentrated expression of this contradiction.
II. Inventory Elimination Analysis: Core City Portraits and Differentiation Logic
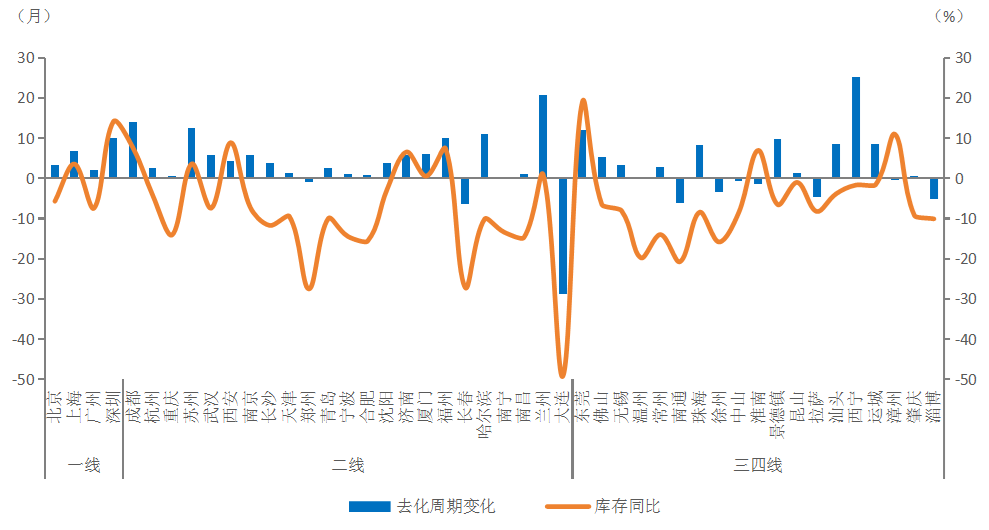
Based on a cross-analysis of changes in inventory year over year and removal cycle (compared to the same period last year), different types of cities reflect very different market operation logic.
Figure 2 Comparison of changes in inventory and removal cycles in key cities in June 2026
Data source: CRIC China Real Estate Decision Consulting System; the removal cycle is calculated based on average monthly transactions for the past 12 months.
(1) Double lift type - inventory and removal cycle increase simultaneously
“Double upgrade” cities, where inventories are rising year over year and removal cycles are currently increasing, are currently the group with the greatest inventory pressure. Typical examples include Shenzhen, Chengdu, Suzhou, Fuzhou, Dongguan, Lanzhou, etc., mainly strong second-tier cities and some hot third- and fourth-tier cities.
Among the first-tier cities, Shenzhen and Shanghai both have double upgrades. In the first half of the year, supply in Shenzhen fell only 6.02% year on year, and transactions fell 5.67% year on year. Supply and demand basically contracted at the same time. However, due to the concentrated entry of high-end projects into the market and the release of improved demand falling short of expectations, inventory increased 14.18% year on year, and the removal cycle increased by 9.89 months to 24.32 months compared to the same period last year. The same was true in Shanghai. Supply fell 13.41% year on year, but transactions fell 27.12% year on year. The sharp contraction in transactions drove inventory growth of 3.59% year on year, and the removal cycle lengthened from 6.69 months to 19.73 months.
Among the strong second-tier cities, the pressure from Chengdu and Suzhou is particularly prominent. The sharp decline in transactions in Chengdu led to a sharp rise in the removal cycle from 14.06 months to 31.77 months; Suzhou supply fell 13.45% year on year, transactions fell 20.83% year on year, inventory increased 3.65% year on year, and the removal cycle lengthened from 12.55 months to 29.64 months.
Among third- and fourth-tier cities, the problems in Dongguan and Lanzhou are the most typical. Affected by the saturation of the immediate demand market and concentrated supply entry, inventory surged 18.98% year on year, and the removal cycle broke through 40 months; Lanzhou was affected by continued weak demand. Although supply fell 12.40% year on year, transactions fell 28.77% year on year, and the removal cycle was drastically lengthened from 20.61 months to 40.44 months.
(2) Inventory declines but cycle increases - loss of efficiency covered by a decline in total volume
“Total inventory declined year on year, and the removal cycle instead increased” is currently the most common type, covering nearly 60% of key cities such as Beijing, Guangzhou, Hangzhou, Wuhan, Nanjing, Tianjin, and Harbin.
The common logic of these cities is that a sharp contraction on the supply side drives down total inventory, but the transaction side shrinks faster, ultimately driving up the elimination cycle. Under this model, the decline in total inventory volume is extremely confusing. It seems that inventory removal is effective; in fact, market removal efficiency and liquidity continue to deteriorate.
Among the first-tier cities, Beijing and Guangzhou all fall into this category. Supply in Beijing fell 41.82% year on year, driving inventory down 5.68% year on year, but transactions fell 1.87% year on year, and the removal cycle increased by 3.29 months to 30.97 months. The reason behind this is the continuous upgrading of the supply structure, and the slow elimination of high-end projects has reduced overall turnover efficiency. Guangzhou's supply fell 30.95% year on year, and inventory fell 7.41% year on year, but transactions only fell slightly by 0.33%, and the removal cycle still increased by 1.75 to 25.86 months. Too high inventory share in peripheral regions and slow removal were the core drag.
Among the weak second-tier and third-tier fourth-tier cities, Harbin and Xining have the deepest degree of divergence. Inventory in Harbin fell 10.07% year on year, but the removal cycle increased sharply by 11.01 months to 71.81 months. Continued weakness in demand completely offset the elimination effect of supply contraction; Xining's inventory fell slightly by 1.65% year on year, but the removal cycle surged 25.11 months to 53.10 months, and market liquidity almost stagnated due to lack of transactions.
(3) Double downsizing - simultaneous optimization of inventory size and turnover efficiency
This is the only type that achieves “double improvement” of inventory and removal cycles. Typical examples include Zhengzhou, Changchun, Dalian, Nantong, Xuzhou, and Zibo. Although such cities have achieved “inventory removal,” the path is not the same — inventory in Zhengzhou shrank sharply by 27.49% year on year, and the removal cycle fell back to 19.37 months, which was a relative stabilization after both supply and demand contracted simultaneously; Dalian's inventory plummeted by 49.18% year over year, and the removal cycle fell sharply by 28.89 months from a high level, more as a result of extreme contraction rather than actual recovery in demand; the absolute level of elimination cycles such as Changchun and Zibo is still high. Overall, most of the double downgraded cities are low energy level or weak second-tier cities after experiencing high inventory pressure in the early stages. The endogenous motivation for improvement is insufficient, and sustainability remains to be seen.
3. Structural Perspective: Cyclic Rise Under the Double Mismatch of Space and Product
The “decline in inventory and upward cycle” in terms of total volume is essentially a centralized externalization of structural contradictions. Using the three core cities of Shanghai, Guangzhou, and Nanjing as samples, it can be seen from the two-dimensional decomposition of products in spatial area and area. Spatial mismatch and product mismatch are the core underlying drivers that drive up the overall elimination cycle and form total divergence.
(1) Regional differentiation: tight balance in the core area, pressure on peripheral areas
The three major cities all showed significant spatial stratification characteristics: the core area of the main city had a low inventory scale, stable removal flow rate, and a tight balance; the peripheral remote suburban area had a high inventory share and a long removal cycle, making it a major risk sedimentary zone, and the mismatch between space supply and demand continued to increase the overall decontamination cycle.
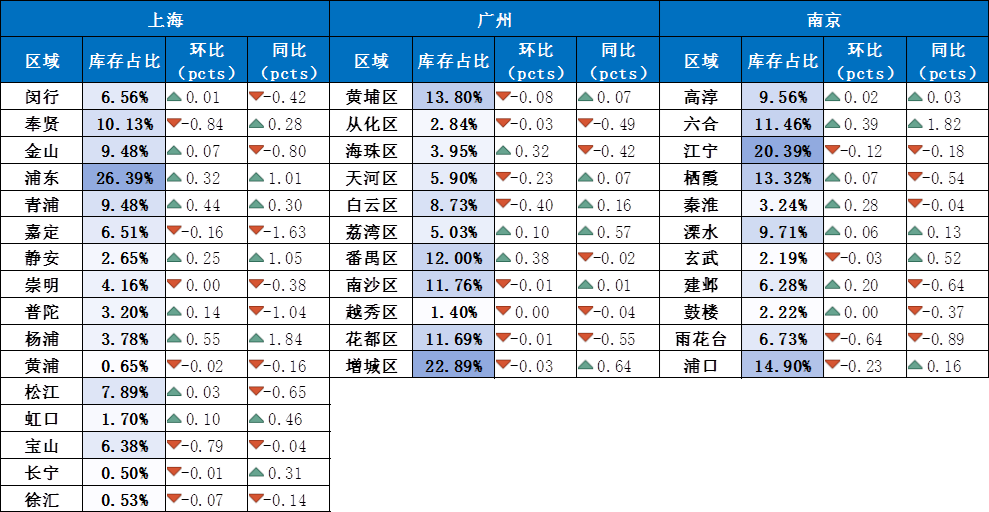
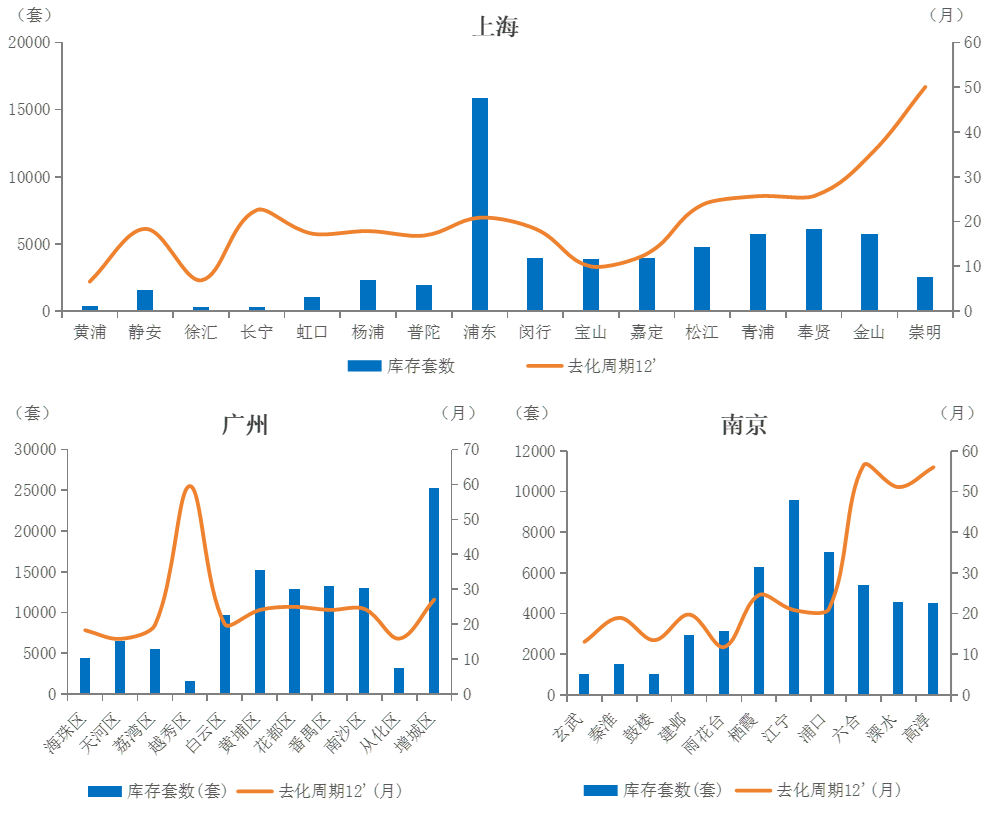
Shanghai's spatial differentiation presents a pattern of “tight core balance and high peripheral pressure”. The total inventory in the seven central districts accounts for less than 15%. Due to the scarcity of the location and maturity of supporting facilities, the removal performance is relatively stable. The Pudong New Area had the highest inventory ratio of 26.39% in the city, with a year-on-year increase of 1.01 pcts. The removal cycle was 20.9 months, and the scale was basically in line with the pressure. Among the peripheral regions, the four districts of Songjiang, Qingpu, Fengxian, and Jinshan accounted for about 36.98%, and the removal cycle was over 23 months. Among them, Jinshan accounted for about 9.48% of the inventory units, a year-on-year decrease of 0.80 pcts, and the removal cycle reached 34.8 months.
Guangzhou's spatial inventory mismatch is more prominent. The five peripheral regions of Zengcheng, Huangpu, Huadu, Panyu, and Nansha account for a total inventory volume of 72.15%, and the removal cycle is over 24 months. The peripheral backlog situation is obvious. Among them, Zengcheng's inventory ratio is 22.89%, leading the city with a removal cycle of 27.1 months. The inventory scale and removal cycle are simultaneously higher than the city average. It is the core pressure area. The core four districts account for about 16.28% of the inventory. With the exception of Yuexiu District, the removal cycle is generally within 20 months. Among them, Tianhe District is the core CBD, and the removal cycle is 15.8 months, and the supporting role of industry and population continues to show.
The decontamination cycle in the three remote suburbs of Nanjing all exceeded 50 months, making up the sedimentary zone with the highest concentration of deoxidation pressure in the city. The Liuhe elimination cycle was 56.5 months, and the share of inventory increased by 1.82 pcts to 11.46% year on year. The increase in share coexists with the high cycle, and the inventory backlog is accelerating. Gao Chun (56.0 months) and Lishui (51.1 months) also remained high. The total inventory in the three regions accounted for more than 30%, and the decontamination cycle was over 4 years. Core areas such as Gulou and Xuanwu in the main city account for a low inventory share, and the decontamination cycle remains within a healthy range of 15 months. In terms of removal efficiency, the removal cycle for new suburban cities such as Jiangning and Pukou is close to the city average due to the gradual implementation of supporting facilities. Among them, Jiangning is the largest inventory area (accounting for 20.39% of inventory sets), and the decontamination cycle is 20.9 months, which basically matches the scale and efficiency; the decontamination cycle of Pukou and Qixia is in the 21-25 month range.
Table 1. Share and changes in the number of inventory sets in the subregion in Shanghai, Guangzhou and Nanjing at the end of June 2026
Data source: CRIC China Real Estate Decision Consulting System.
Figure 3 Changes in inventory numbers and removal cycles in Shanghai, Guangzhou, and Nanjing at the end of June 2026 (by region)
Data source: CRIC China Real Estate Decision Consulting System
(2) Product differentiation: adaptation of supply and demand in mainstream area segments, product pressure on both ends
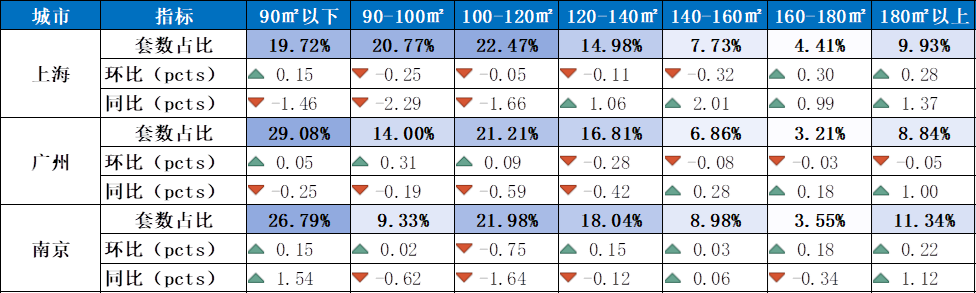
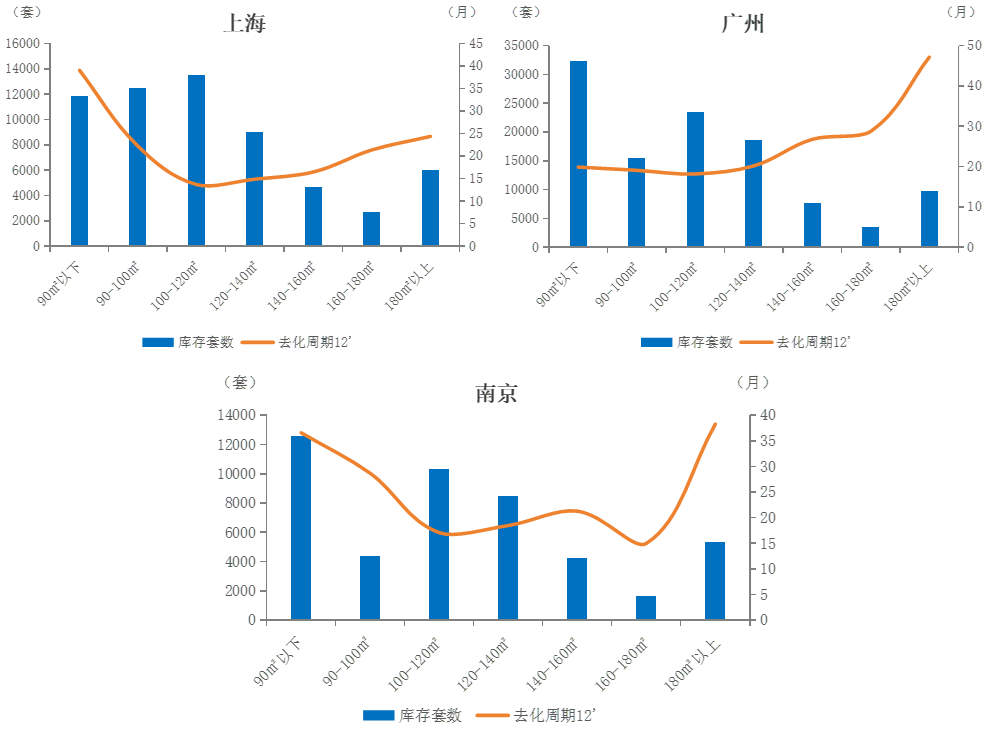
Looking at the product structure in the area segment, with the exception of Guangzhou, Shanghai and Nanjing both show common characteristics of “stable in the middle and pressure on both ends”: 100-140 square meters mainstream improves the compatibility between supply and demand, and the removal efficiency is the highest; small apartments below 90 square meters and large apartments above 180 square meters have become elimination blockages, and product structure mismatches continue to reduce overall turnover efficiency.
Shanghai has a dumbbell pattern of “central health, pressure on both ends”. The inventory of 100-120 square meter units accounts for 22.47% of all area segments, but the removal cycle is only 13.7 months, the lowest in the city, and the best match between supply and demand. In contrast to this, the proportion of small apartments under 90 square meters decreased by 1.46 pcts year on year, but the removal cycle was as high as 39.1 months. Although the share declined, the removal cycle was still rising, and the “volume reduction and flow rate reduction” dilemma has not yet been solved. In terms of large improved apartments, the proportion of 140-160 square meters increased by 2.01 pcts, and the removal cycle was 16.5 months, which is still within a reasonable range; however, the proportion of products over 180 square meters increased by 1.37 pcts to 9.93%, and the removal cycle has reached 24.4 months. The proportion is rising at the same time as the cycle, and the capacity to absorb demand for high-end improvements is marginally declining.
Guangzhou's core contradiction is “slow sales of large, improved apartments” rather than “just excess demand.” Small apartments under 90 square meters account for 29.08% of the area, but the removal cycle is 19.9 months, which is lower than the city average, and the flow rate is fair. On the other hand, products over 180 square meters accounted for only 8.84%, but the removal cycle was as high as 47.2 months, which is the highest removal pressure in the same area of the three cities. The removal cycle for products over 140 square meters is over 26 months, far exceeding the city average, and has become a structural blockage that increases the overall removal cycle in Guangzhou.
Nanjing is the city with the most extreme segmentation in the three cities, presenting a “double height” dilemma at both ends. The proportion of small apartments under 90 square meters increased by 1.54 pcts to 26.79% year on year, and the removal cycle reached 36.6 months. The proportion increased in sync with the cycle, which is a typical “passive backlog”. The share of units over 180 square meters increased by 1.12 pcts to 11.34%, and the removal cycle was as high as 38.3 months, which also showed “double height” characteristics. The decontamination cycle for the 100-140 square meter mainstream improvement area is 17-19 months. The removal efficiency is optimal, but the size is insufficient to hedge the removal pressure on both end products, and the overall decontamination cycle in the city is still as high as 26.67 months.
Table 2 Share and changes in inventory units by area segment in Shanghai, Guangzhou, and Nanjing at the end of June 2026
Data source: CRIC China Real Estate Decision Consulting System
Figure 4 Changes in inventory numbers and removal cycles in Shanghai, Guangzhou, and Nanjing at the end of June 2026 (by area segment)
Data source: CRIC China Real Estate Decision Consulting System
In summary, the divergence of “total volume decline and high cycle” in the first half of 2026 is essentially a product of passive inventory removal. The decline in inventories in most cities depended on supply contraction rather than demand recovery, and the elimination cycle generally increased; market differentiation continued to deepen along the triple dimension of “urban energy level - spatial area - product structure”. The core sector of core cities maintained relative resilience with mainstream improvement products, while weak energy cities, remote outlying suburbs, and products at both ends of the area segment became the main risk accumulation area.