
July 2026 Global Stocks That Might Be Trading Below Fair Value
In July 2026, global markets have been marked by a mix of volatility and resilience, with major indices experiencing fluctuations amid shifting economic indicators such as cooling inflation rates and geopolitical tensions. As investors navigate these uncertain waters, identifying stocks that may be trading below their fair value can offer potential opportunities for those looking to capitalize on market inefficiencies.
Top 10 Undervalued Stocks Based On Cash Flows
| Name | Current Price | Fair Value (Est) | Discount (Est) |
| Zylox-Tonbridge Medical Technology (SEHK:2190) | HK$19.53 | HK$38.97 | 49.9% |
| Sichuan Kelun-Biotech Biopharmaceutical (SEHK:6990) | HK$486.40 | HK$964.33 | 49.6% |
| Shoucheng Holdings (SEHK:697) | HK$1.60 | HK$3.18 | 49.7% |
| Plus Alpha ConsultingLtd (TSE:4071) | ¥2396.00 | ¥4775.93 | 49.8% |
| Loncin Motor (SHSE:603766) | CN¥13.58 | CN¥27.03 | 49.8% |
| Koskisen Oyj (HLSE:KOSKI) | €8.66 | €17.17 | 49.6% |
| JOST Werke (XTRA:JST) | €55.60 | €110.79 | 49.8% |
| Dustin Group (OM:DUST) | SEK1.774 | SEK3.53 | 49.7% |
| Com.Tel (BIT:CMTL) | €1.87 | €3.70 | 49.5% |
| Cambi (OB:CAMBI) | NOK21.30 | NOK42.54 | 49.9% |
Here's a peek at a few of the choices from the screener.
Loncin Motor (SHSE:603766)
Overview: Loncin Motor Co., Ltd. manufactures and sells generating sets, agricultural machinery equipment, light-duty power units, and two-wheeled motorcycles in Japan and internationally, with a market cap of CN¥26.80 billion.
Operations: The company's revenue segments include generating sets, agricultural machinery equipment, light-duty power units, and two-wheeled motorcycles for both the Japanese and international markets.
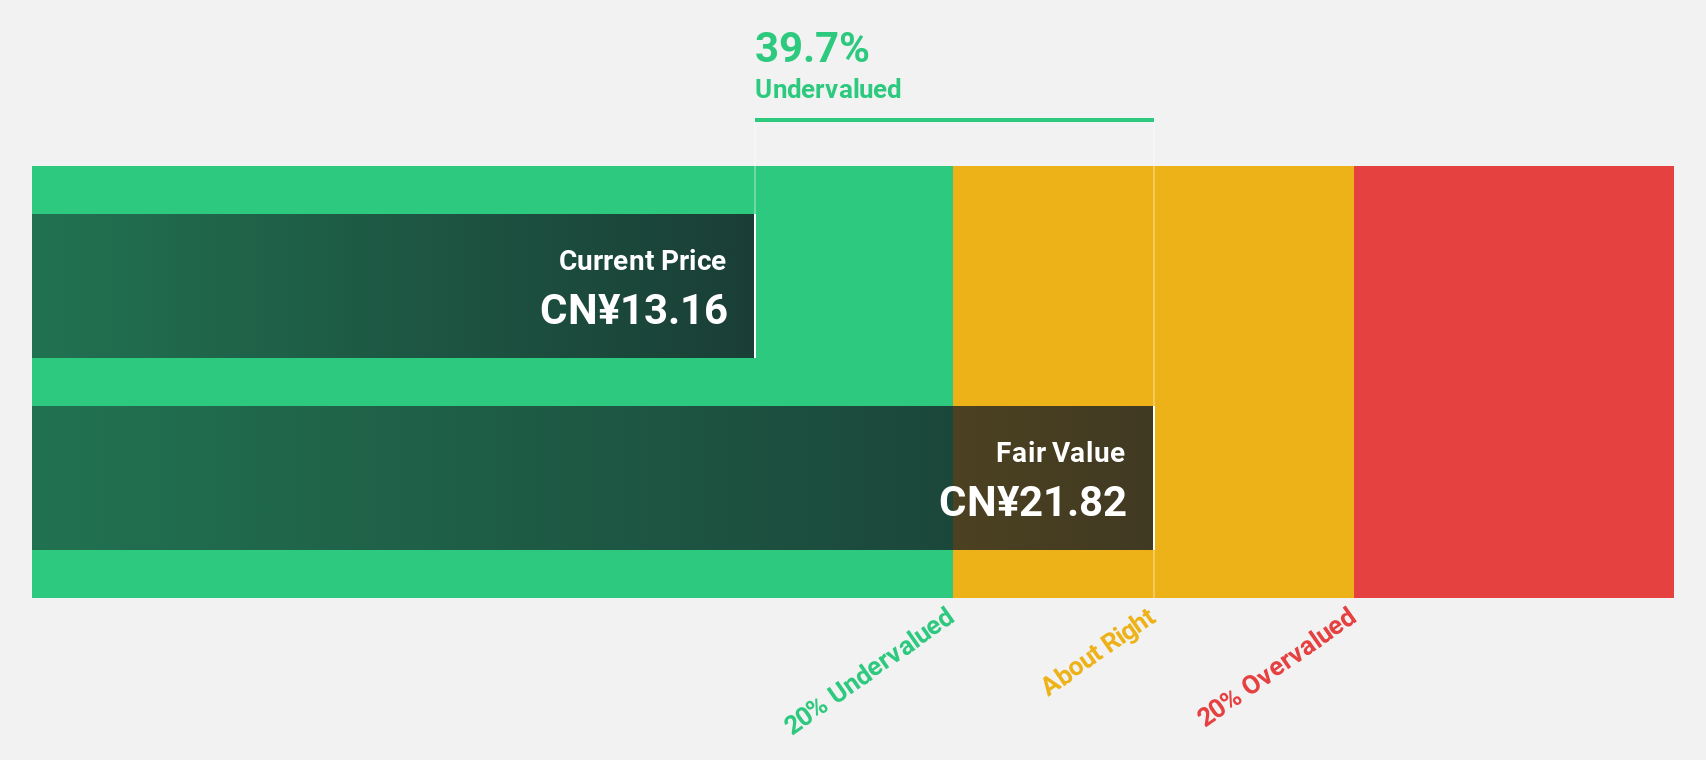
Estimated Discount To Fair Value: 49.8%
Loncin Motor, trading at CN¥13.58, is significantly undervalued based on discounted cash flow analysis with an estimated future cash flow value of CN¥27.03. Analysts agree the stock price could rise by 51.4%. Earnings grew 17.6% last year and are forecast to grow 23.35% annually over the next three years, though revenue growth is slower than market expectations at 16.8%. The dividend track record remains unstable despite strong earnings potential.
- Our earnings growth report unveils the potential for significant increases in Loncin Motor's future results.
- Click here to discover the nuances of Loncin Motor with our detailed financial health report.
Ugreen Group (SZSE:301606)
Overview: Ugreen Group Limited is involved in the design, research, production, and sale of consumer electronics products both in China and internationally, with a market cap of CN¥23.53 billion.
Operations: The company generates revenue of CN¥10.47 billion from the consumer electronics industry.
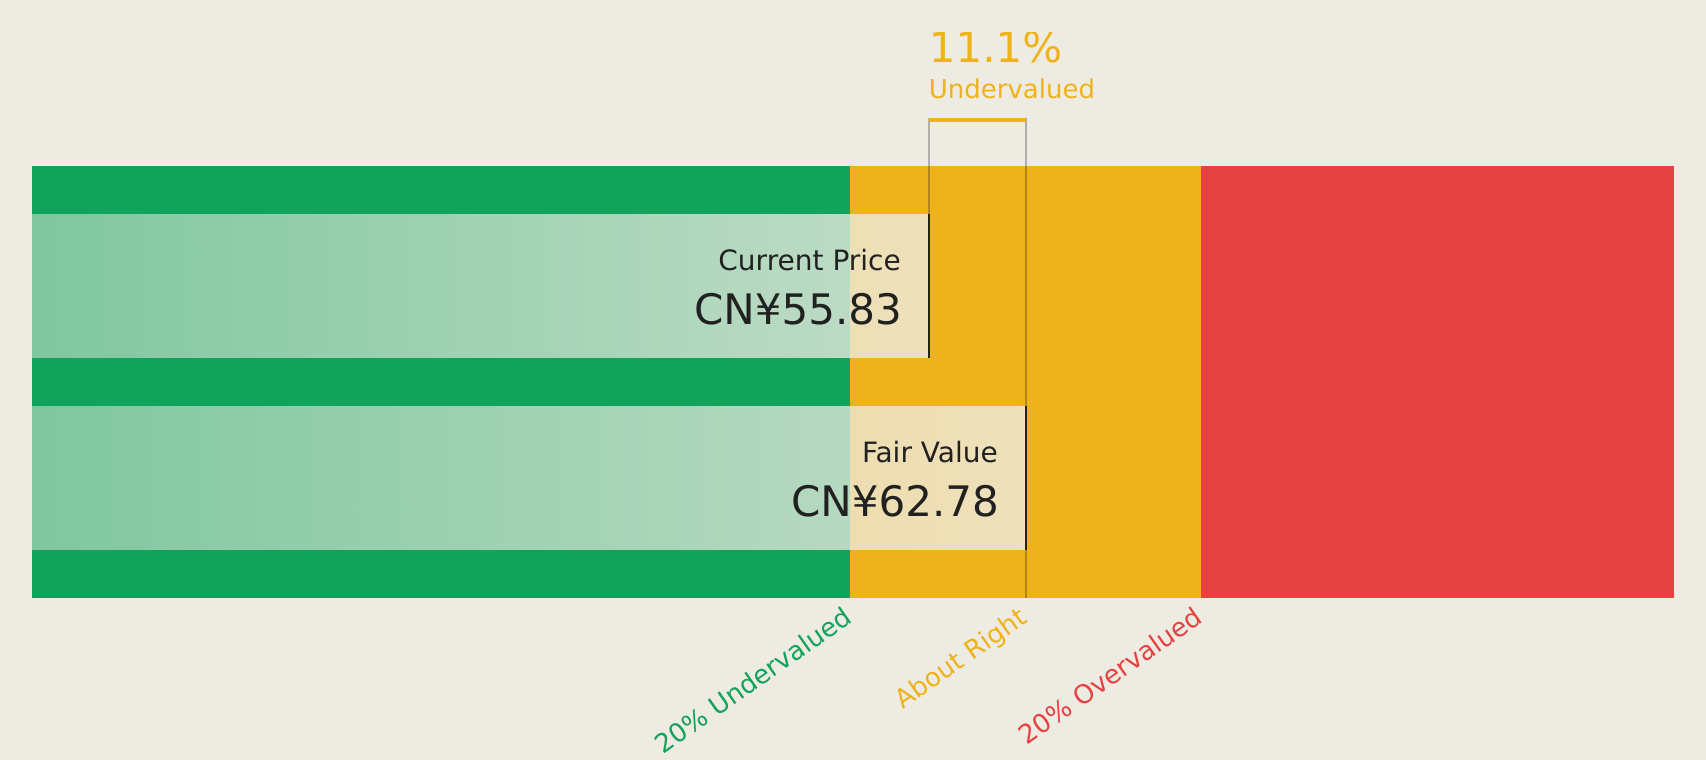
Estimated Discount To Fair Value: 5.2%
Ugreen Group is trading at CN¥56.7, slightly below its estimated future cash flow value of CN¥63.17, suggesting it may be undervalued based on cash flows. With earnings growth of 55.1% last year and a forecasted annual profit increase of 27%, Ugreen shows strong potential despite a dividend not well covered by free cash flows. Recent strategic alliances and product launches, including collaborations with HoYoverse and new NAS products, support its growth trajectory in the technology sector.
- Insights from our recent growth report point to a promising forecast for Ugreen Group's business outlook.
- Get an in-depth perspective on Ugreen Group's balance sheet by reading our health report here.
Synnex Technology International (TWSE:2347)
Overview: Synnex Technology International Corporation, along with its subsidiaries, is engaged in the distribution of information, communication, consumer, and semiconductor products with a market cap of NT$142.28 billion.
Operations: The company's revenue is primarily derived from its Distribution Business Group, which accounts for NT$298.28 billion, and its Semiconductor Business Group, contributing NT$173.79 billion.
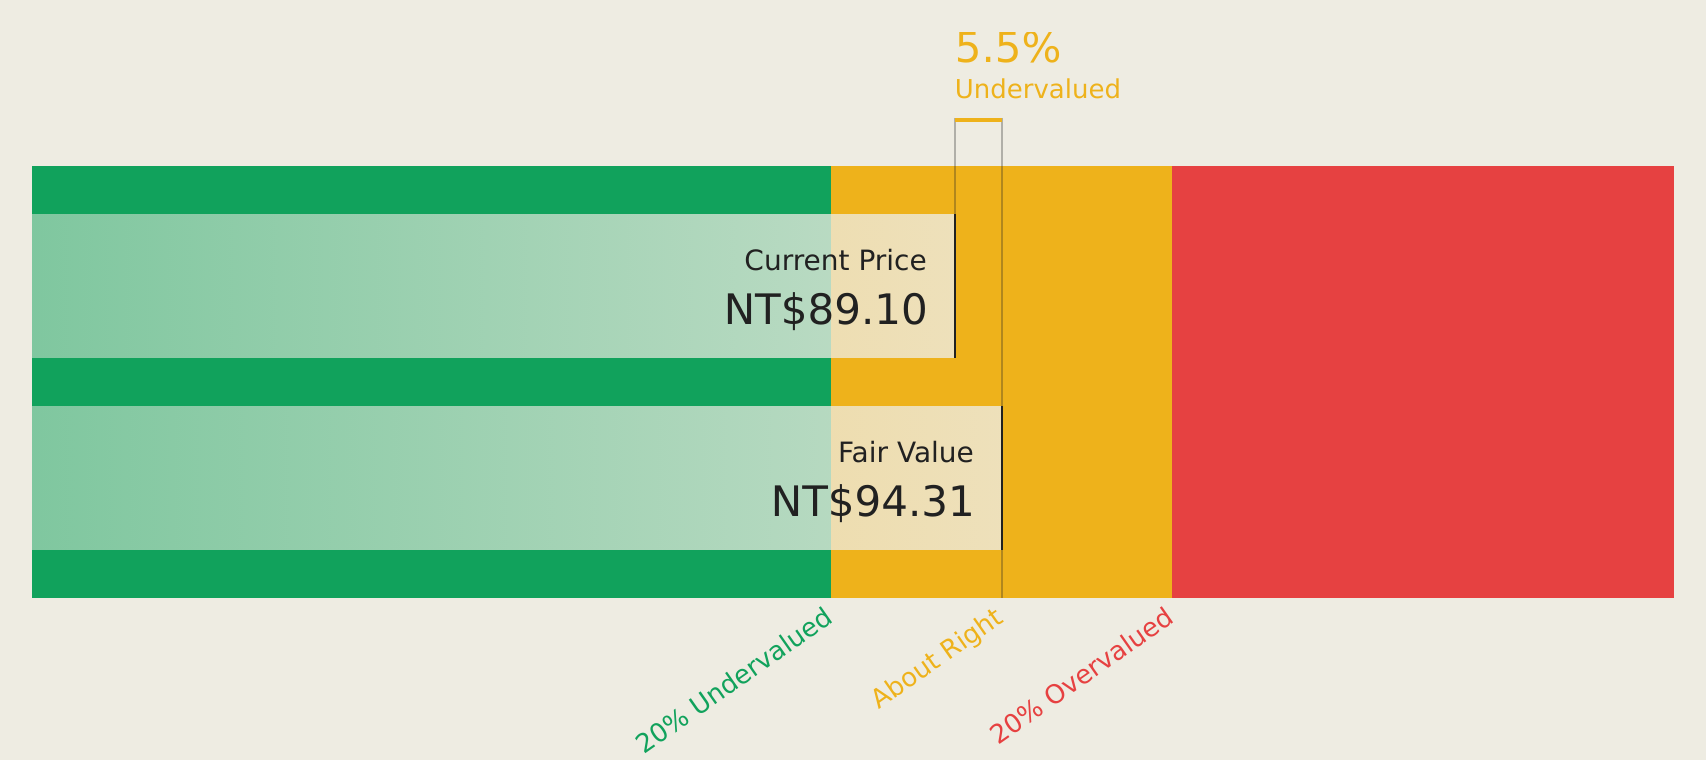
Estimated Discount To Fair Value: 11%
Synnex Technology International, trading at NT$84.6, is undervalued compared to its estimated future cash flow value of NT$95.05. Recent earnings growth and a forecasted annual profit increase of 28.6% highlight strong financial health, although debt coverage by operating cash flow remains a concern. The company's revenue growth outpaces the market at 22.6%, but its dividend yield of 4.96% lacks sufficient free cash flow support, which may impact long-term sustainability.
- In light of our recent growth report, it seems possible that Synnex Technology International's financial performance will exceed current levels.
- Unlock comprehensive insights into our analysis of Synnex Technology International stock in this financial health report.
Make It Happen
- Click through to start exploring the rest of the 425 Undervalued Global Stocks Based On Cash Flows now.
- Are any of these part of your asset mix? Tap into the analytical power of Simply Wall St's portfolio to get a 360-degree view on how they're shaping up.
- Discover a world of investment opportunities with Simply Wall St's free app and access unparalleled stock analysis across all markets.
Contemplating Other Strategies?
- Explore high-performing small cap companies that haven't yet garnered significant analyst attention.
- Diversify your portfolio with solid dividend payers offering reliable income streams to weather potential market turbulence.
- Fuel your portfolio with companies showing strong growth potential, backed by optimistic outlooks both from analysts and management.
This article by Simply Wall St is general in nature. We provide commentary based on historical data and analyst forecasts only using an unbiased methodology and our articles are not intended to be financial advice. It does not constitute a recommendation to buy or sell any stock, and does not take account of your objectives, or your financial situation. We aim to bring you long-term focused analysis driven by fundamental data. Note that our analysis may not factor in the latest price-sensitive company announcements or qualitative material. Simply Wall St has no position in any stocks mentioned.
Have feedback on this article? Concerned about the content? Get in touch with us directly. Alternatively, email editorial-team@simplywallst.com