
China Automobile Dealers Association: The transaction volume of the national used car market in June was 1,618,400 vehicles, and the transaction amount was 107.158 billion yuan
The Zhitong Finance App learned that on July 20, the China Automobile Dealers Association released a brief analysis of the used car market in June 2026. In June 2026, the volume of transactions in the national used car market was 1.618,400 vehicles, up 1.05% from the previous month, down 2.36% year on year, and the transaction amount was 107.158 billion yuan. From January to June 2026, the cumulative transaction volume of used cars was 9.713,200 units, up 1.50% year on year. Compared with the same period, an increase of 143,300 units was added, and the cumulative transaction amount was 638.530 billion yuan.
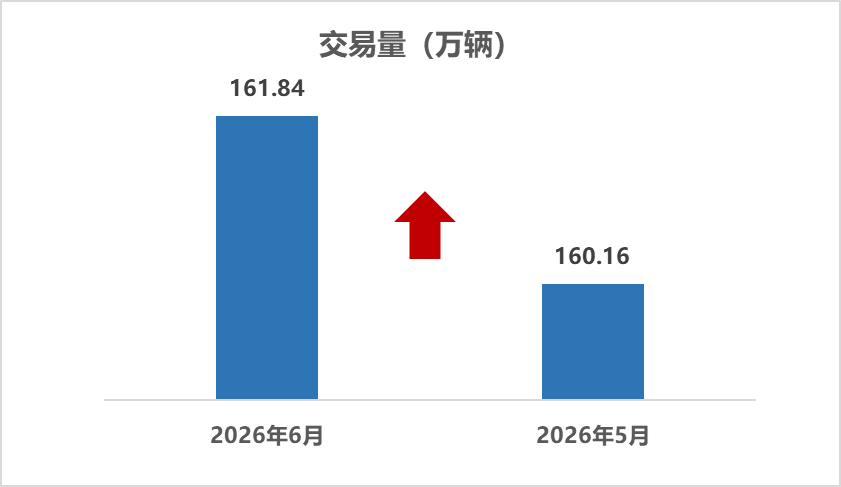
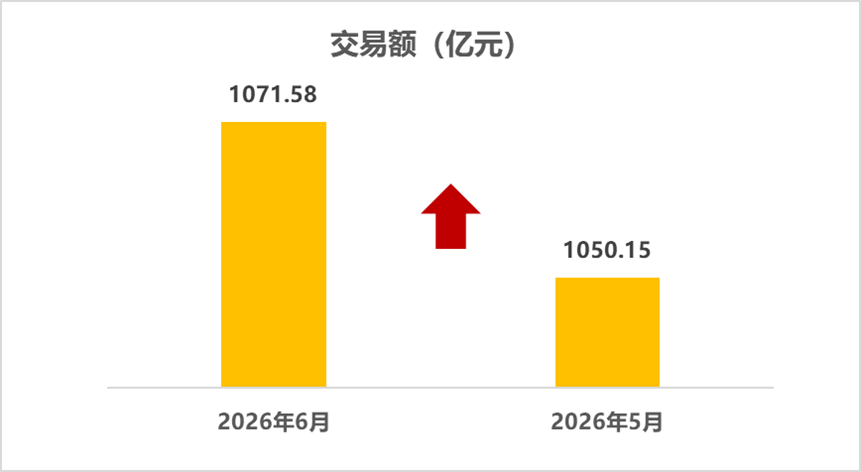
Analysis of the structure of used cars by model in June 2026
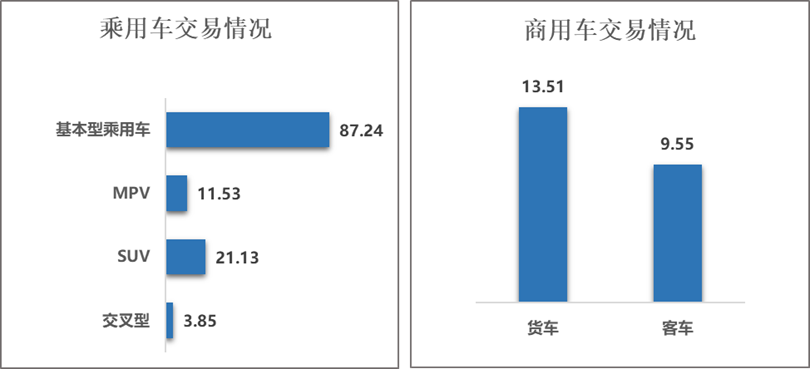
Passenger car situation: In June, a total of 872,400 basic passenger cars were traded, up 1.48% from the previous year, down 5.45%; a total of 21.13 million SUVs were traded, down 0.8% from the previous year, down 2.26% year on year; total MPV units were traded, up 1.17% month on month, up 5.09% year on year; and 38,500 passenger cars were traded, up 0.83% month on month, down 7.25% year on year.
Commercial vehicle situation: A total of 95,500 buses were traded, up 0.19% from the previous month, down 0.27% from the previous year; 135,900 trucks, down 0.61% from the previous year, down 7.81% from the previous year.
In January-June, a total of 7.454 million passenger cars were traded, a year-on-year decrease of 1.54%. Among them: 5.243 million basic passenger cars were traded, a year-on-year decrease of 3.48%; a total of 1.286,400 SUVs were traded, an increase of 1.49%; a total of 687,700 MPVs were traded, an increase of 9.99%; and a total of 233,400 passenger cars were traded, a year-on-year decrease of 3.81%. A total of 1.4052 million commercial vehicles were traded, an increase of 4.94% over the previous year. Among them: 827,300 trucks were traded, up 3.52% year on year; 577,900 buses were traded, up 7.05% year on year.
Analysis of the service life of used car trading vehicles in June 2026
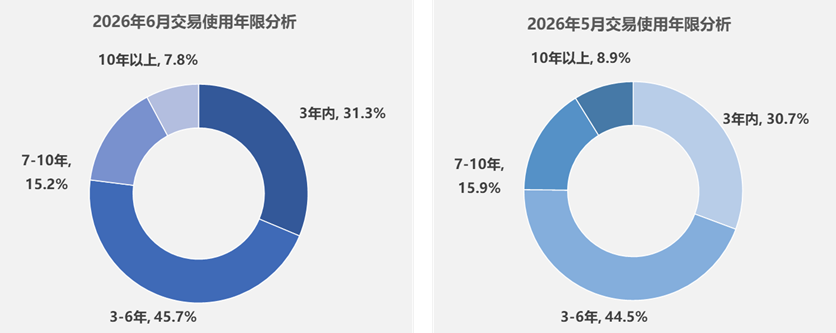
In June, used cars with a lifespan of 3-6 years accounted for the largest share of transactions, accounting for 45.7%, up 1.2 percentage points from month to month, up 3.4 percentage points; models within 3 years of use accounted for 31.3%, up 0.6 percentage points from month to month, up 3.8 percentage points from year to year; models aged 7-10 years accounted for 15.2%, down 0.7 percentage points from month on month, down 2.8 percentage points from year on year; models over 10 years old accounted for 7.8%, down 1.1 percentage points from month on month, down 4.5 percentage points year on year.
Analysis of the situation in the six major regions in June 2026
Used car transactions in the six major regions in June 2026
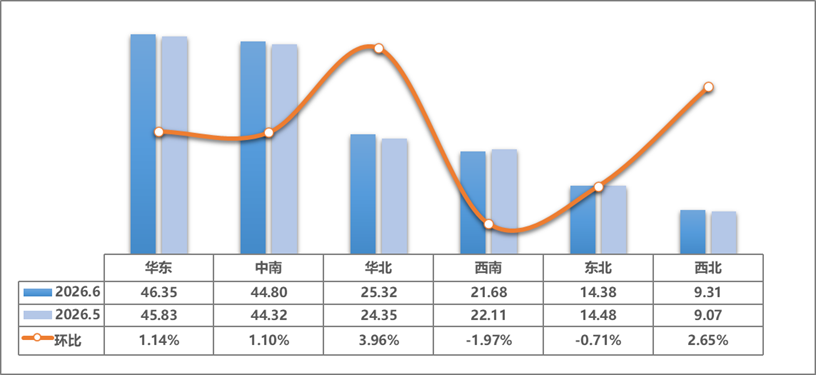
In June 2026, the national used car market ended the global pullback trend last month. Most of the six major regional transactions increased month-on-month, and the market showed a pattern of mostly recovery, slight partial adjustments, and regional growth differentiation. Trading volume in the core region continues to be high, with significant differences in the pace of rise and fall: North China and Northwest China have strong growth momentum, and East China and Central South China have steadily rebounded slightly; the Southwest and Northeast regions have declined slightly month-on-month, and there is partial recuperation pressure on the market. The overall national market showed a slight recovery trend, but the upward momentum is weak, and sustainability still requires follow-up data monitoring and observation.
The volume of used car transactions in East China was 463,500 units, up 1.14% from the previous month. The trading volume ranked first in the country, and the leading position in the region was stable. The decline was halted, and the growth rate was in line with the national average. The resilience of market operations continued to be prominent, and the scale of transactions expanded steadily.
The volume of used car transactions in the central and southern regions was 448,000 units, up 1.10% from the previous month. The market ended last month's recuperation, and demand was released moderately. The transaction scale remained the second largest in the country. The rate of recovery was basically the same as the national average, the market was recovering steadily, and the pace of operation was steady.
The volume of used car transactions in North China was 253,200 units, up 3.96% from the previous month, ranking first in the six major regions. The momentum of phased recovery was relatively prominent, the restoration efforts were significantly higher than the national average, and the regional growth momentum was relatively good.
The volume of used car transactions in the southwest region was 216,800 units, down 1.97% from the previous month. It is one of only two regions with a month-on-month decline this month. The market entered a short-term recuperation phase, and the slight correction was in line with phased demand fluctuations.
The volume of used car transactions in the Northeast region was 143,800 units, down 0.71% from the previous month. The decline was the lowest in the six major regions. The overall market remained flat, and the operating trend was highly stable, with only minor adjustments.
The volume of used car transactions in the northwest region was 93,100 units, up 2.65% from the previous month. The growth was second only to the North China region, and the phased recovery performance was relatively impressive; affected by the small size of the overall base, market flexibility was outstanding, and the pace of phased restoration accelerated markedly.
Cross-regional circulation situation in June 2026
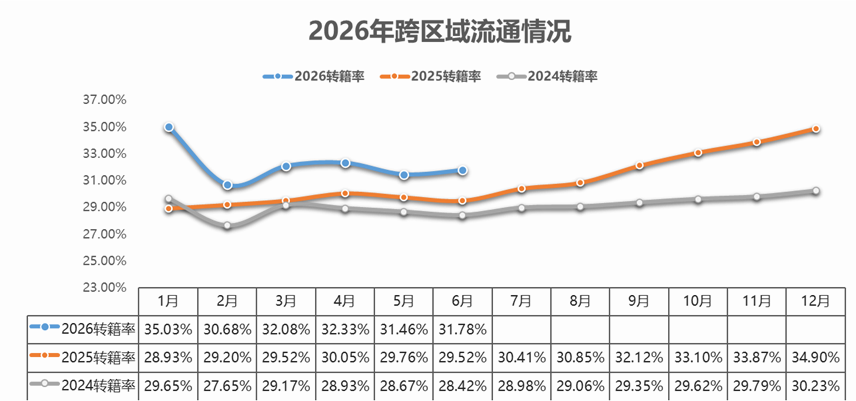
In June, the used car transfer rate was 31.78%, up 0.32% from the previous month and 2.26% from the same period last year. The total number of used car transfers was 514,300, an increase of 2.07% over the previous year, and an increase of 5.12% over the same period last year.