
Bitcoin ushered in a sign of bottoming out? Spot ETFs end an eight-week “blood loss” decline: net capital inflows for two consecutive weeks, but geopolitical risks and regulatory fog are still suppressing the rebound
The Zhitong Finance App learned that after two months of record capital flight, US spot Bitcoin ETFs have finally ushered in continued capital inflows. In the past two weeks, 13 spot Bitcoin ETFs recorded a total net inflow of about US$273 million, ending eight consecutive weeks of cumulative capital losses of over US$8 billion. This reversal occurred under extreme pressure from the escalation of the military conflict between the US and Iran and the outflow of funds of up to 425 million US dollars in a single day on Monday. It is seen as a key sign that the cryptocurrency market may be bottoming out.
Despite this, the scale of inflows is still insignificant compared to previous outflows. Bitcoin's price is still struggling to hover in the $60,000-$65,000 range due to geopolitically-induced inflation concerns, repeated expectations of interest rate hikes by the Federal Reserve, and the impasse in key US crypto legislation.
Capital reversal: From a single weekly outflow of $1.79 billion to net inflow for two consecutive weeks
The strength of the reversal in capital flows this time is in stark contrast to previous outflows. In eight weeks of capital flight, investors have withdrawn more than $8 billion from Bitcoin ETFs. Among them, a net outflow of 1.79 billion US dollars was recorded for the week ending June 26, the second highest in history. Total cumulative net inflows of ETFs plummeted from US$59.34 billion to US$51.08 billion.
The reversal began in mid-July. Over the past two weeks, Bitcoin ETFs have recorded a total net inflow of approximately $273 million. Looking at single-day data, inflows of US$181 million on Tuesday, US$107.8 million on Wednesday, US$79.15 million on Thursday, and US$132.3 million on Friday — maintained a net inflow trend for four consecutive trading days.
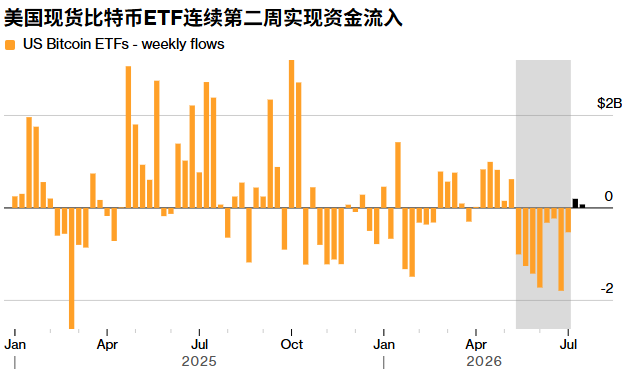
What is more noteworthy is the breadth of funding distribution. According to Santiment data, the recovery in demand was not concentrated on a single product, but scattered across multiple publishers. Fidelity's FBTC contributed the most in the early stages of the rebound, absorbing around US$166 million; ARKB recorded a net inflow of about US$91.8 million; BlackRock IBIT then flowed in a single day of US$138.9 million. Simultaneous improvements in multiple funds have weakened the term “pure technical inflow”, which better reflects the re-participation of a wider range of institutions.
Meanwhile, spot Ethereum ETFs performed even better. Last week's net inflow of $105.4 million continued the previous week's momentum of $84.42 million. The Ethereum ETF also experienced eight consecutive weeks of capital losses, with cumulative losses exceeding US$1.1 billion.
Richard Galvin, executive chairman of cryptocurrency investment firm DACM, said: “Given the size and coverage of ETFs, they have become a good measure of Bitcoin and the overall sentiment of the industry. After eight consecutive weeks of decline, it is now confirmed within two weeks, which is a positive sign.”
Technical recovery: Bitcoin returns to the 200-week EMA, but still falls short of its all-time high
The price of Bitcoin has returned above the 200-week moving average, which is at around $63,300, and is seen as the key dividing line between a long-term bear market or a bull market. Bitcoin's price has been hovering in the $60,000-$65,000 range for weeks due to macroeconomic uncertainty.
Even after the US launched a new round of air strikes on Iran, Bitcoin showed resilience in the Asian market, breaking through $65,000 in early trading on July 20. As of early Asian trading, Bitcoin is currently around $64,725.
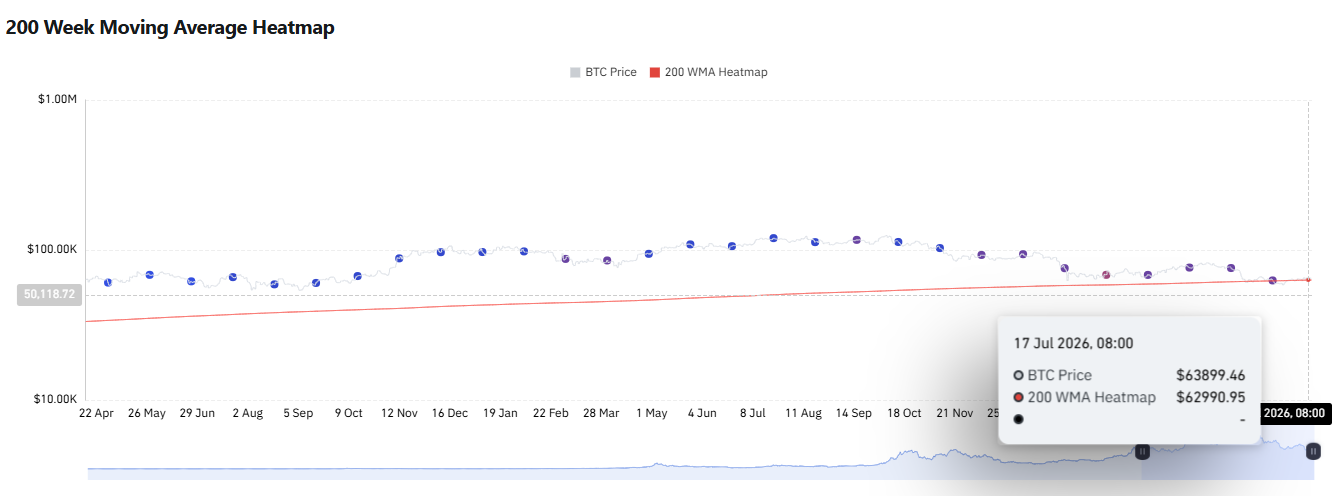
However, looking at the magnified time dimension, the price of Bitcoin is still about 50% lower than the historical high of $126,000 in October 2025. Since 2026, the cumulative decline in Bitcoin is still as high as 26%. Judging from the technical pattern, the 4-hour cycle showed a broad upward pattern of fluctuations, but a one-sided trend has not yet formed. The above $65,600 forms a key resistance zone. If no volume breakout is possible, there is still a risk that the market will retreat.
Geographical and macroeconomic suppression: the US-Iran conflict ignites concerns about inflation, and expectations of interest rate hikes are repeatedly tugged
The reason why this capital reversal is remarkable is that it occurred amid the dual headwinds of geopolitics and the macro environment. On July 7, the US Central Command announced that it had completed a new round of large-scale military attacks against Iran, hitting more than 80 targets, including Iran's air defense systems, command and control networks, and more than 60 small speed boats of the Islamic Revolutionary Guard Corps of Iran. Since then, the US military has continued to launch attacks on Iranian targets. As of July 20, they have carried out attacks for the eighth consecutive night. As the tension between the US and Iran continues to escalate, Brent crude oil has returned above $90 per barrel.
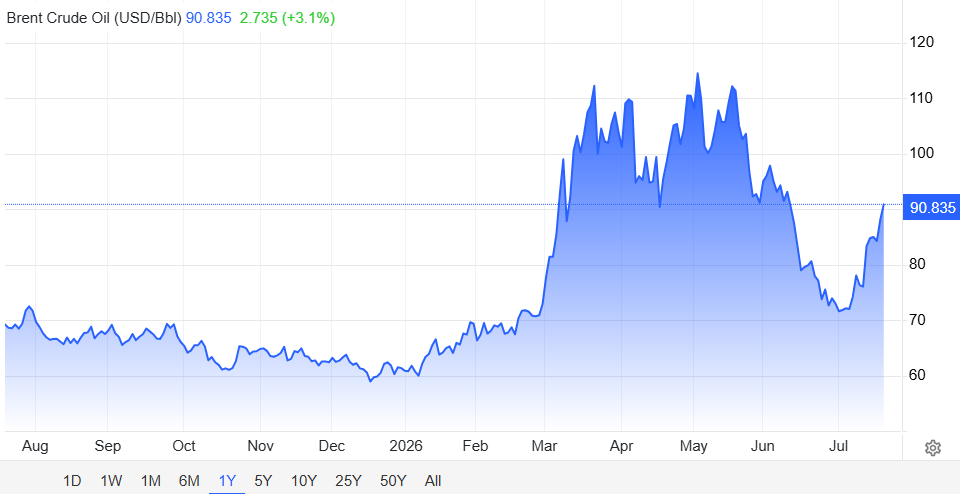
The tense situation in the Strait of Hormuz directly boosted oil prices and fueled concerns about inflation. Historically, a warming situation in the region usually triggers the classic reaction of investors reducing their exposure to risk-assets and turning to traditional safe-haven assets such as oil and gold. Damien Loh, chief investment officer at Ericsenz Capital, said: “The reason the US-Iran conflict is important is because it pushes up interest rates, and interest rates affect all risky assets.”
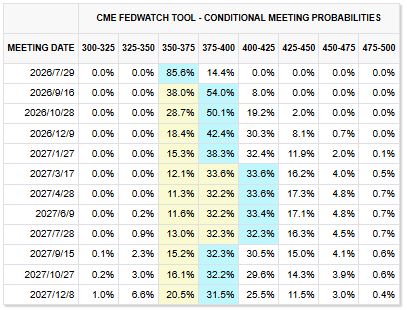
The Federal Reserve has maintained interest rates in the 3.5% to 3.75% range since the beginning of 2026. Although the US CPI data for June fell short of expectations — overall inflation fell 0.4% month-on-month, the biggest monthly decline since April 2020 — once depressed the probability of interest rate hikes to 15.5% in July, the risk of inflation due to the geopolitical conflict quickly rebounded expectations. CME FedWatch data showed that the probability of a July rate hike once soared to 46.5%. As of July 20, that probability had fallen back to around 14%.
“The prospect that the Federal Reserve may raise interest rates may hinder the full return of institutional capital,” Loh added.
Regulatory variables: The “Clarity Act” passes through the Senate, and the probability of passing it is only 38%
Another key catalyst the market is looking forward to — the US Cryptocurrency Market Structure Act “CLARITY Act” — is still stuck in the Senate. The bill passed the House of Representatives with 294 votes in favor and 134 against in July 2025, and was approved by a 15-9 bipartisan vote of 15-9 in the Senate Banking Committee on May 14, 2026. However, there are only about 20 working days left until the Senate recess on or about August 7, and the bill has not yet been submitted to the full house for a vote.
According to Polymarket data, the probability that the bill will pass in 2026 is only 38%. The Republican Party holds 53 seats, but at least 2 Republican senators are expected to vote against it, and the leadership needs at least 7 Democrats to defy to reach the 60 vote threshold to end the debate. There are still four unresolved disputes: moral provisions on official cryptocurrency holdings, law-enforcement objections to Section 604 non-custodial developer protection clauses, the banking industry's resistance to stablecoin revenue loopholes, and the issue of vacant CFTC membership.
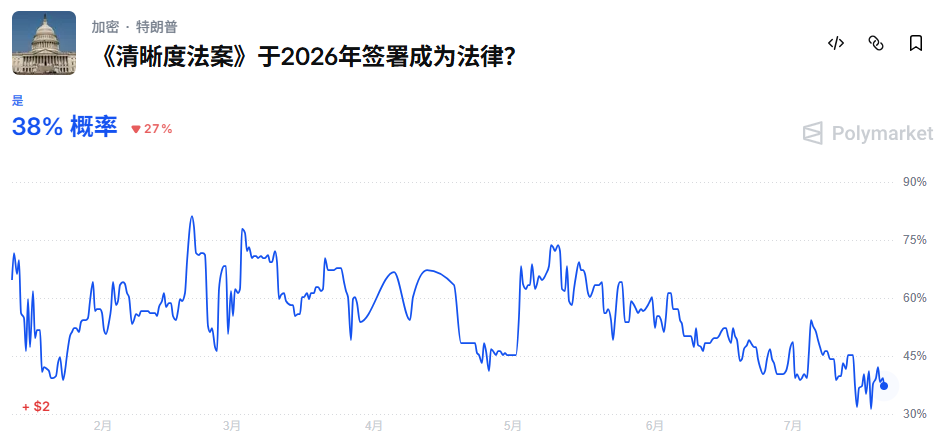
Loh pointed out that if the bill is passed before the August recess, it could be a catalyst for Bitcoin's price increase. However, as the time window gets narrower, this hope is becoming more dim.
Notably, Bitcoin itself has been classified as a commodity by the SEC and CFTC at the same time, and there is no need to rely on the Clarity Act to obtain regulatory clarity. This makes Bitcoin a major safe-haven asset in the cryptocurrency sector among alternative coins facing regulatory uncertainty, including XRP and Solana.
The paradox of the largest coin holding company: Strategy's first large-scale sell-off caused the narrative to falter
While ETF funds are returning, another key variable is unraveling — Strategy (MSTR.US), the world's largest Bitcoin holder, is shaking its long-term commitment to “never sell coins.”
Since Strategy revealed in early June that it had sold a small amount of its Bitcoin holdings for the first time since 2022, the price of Bitcoin has dropped by about 10%. On July 6, Strategy disclosed the sale of 3,588 bitcoins to cash out approximately $216 million to pay dividends on preferred shares and raise cash reserves. This is the first time that the company has actively reduced its holdings on this scale since it began to accumulate Bitcoin on a large scale in 2020. As of July 5, the company's Bitcoin reserves fell to 843,775.
This move has multiple and far-reaching effects. First, the company holds about 2.55 billion US dollars in cash and chooses to sell coins instead of issuing additional common shares when it has sufficient capital, which is very different from its usual path. Second, the core investment narrative of continued growth in “currency content per share” was shattered. Third, the market is highly wary of a systemic sell-off crisis that may be triggered when its cash flow is exhausted — the company faces annual dividend and interest obligations of 1.8 billion US dollars, and the 20,000 Bitcoin holdings reduction quota approved by the shareholders' meeting is likely to be implemented.
Strategy's core valuation indicator, MNAV, has fallen below 1, meaning that the market is valuing it below the value of its Bitcoin holdings. The company's stock price has fallen by about 75% in a year. Founder Michael Saylor once positioned the company as a “never sell” Bitcoin accumulator, but has now made it clear that he would prefer to sell Bitcoin when necessary.
Bottom-building or a trap?
Two consecutive weeks of net ETF inflows, Bitcoin's return above the 200-week EMA, and the resilience shown by the Asian market in the face of a geopolitical conflict — all of these signals form a cautiously optimistic bottom-up narrative.
However, concerns cannot be ignored either. The two states combined inflows of 273 million US dollars. Compared with the outflow of more than 8 billion US dollars in the previous eight weeks, there is a huge difference in scale. Analysts pointed out that the cumulative net inflow of Bitcoin ETFs in 2026 is still negative, about US$5.4 billion. Crypto analysis firm BRN said in a report: “First, observe ETF capital flows. Many weeks of positive trends will indicate a structured re-entry of institutional capital into the market.”
At the macro level, the market is closely watching whether the long-awaited Clarity Act (Clarity Act) can be passed before the US Congress adjourns in August. If passed, the bill could be a catalyst for Bitcoin's price increase. Until then, whether Bitcoin can maintain its current support level between the continuing escalation of the US-Iran conflict and the uncertainty of the Federal Reserve's policy will determine whether this “bottoming out” is a trend reversal or another brief period of noise.
Bitcoin stands at a critical crossroads. Whether the $65,600 resistance level can be effectively broken will determine whether this round of rebound is a trend reversal or a “dead cat jump.” Meanwhile, the Federal Reserve's interest rate decision on July 29, the legislative window before the National Assembly adjourns on August 7, and Strategy's next position operation will be the core variables worth paying attention to in the coming weeks.