
Interactive Brokers (IBKR) Stock Looks Pricey For New Investors Today
After Interactive Brokers Group stock delivered a very large 5 year total return of about 5.1x, the current checks point to a more cautious picture, with the Excess Returns intrinsic value estimate sitting close to the market price while earnings based multiples lean expensive.
- Over the past 5 years, Interactive Brokers Group has returned roughly 511.7%, which puts added pressure on today’s buyers to justify the valuation with future cash flows.
- Recent expansion of its electronic brokerage platform, including broader access to South Korean markets, can support growth expectations, but reliance on trading activity and market sentiment remains a key risk for how sustainable those expectations are.
- On Simply Wall St’s broader checks, Interactive Brokers Group scores 1 out of 6 for value, which leans more towards a stock that is not a clear bargain at the current price.
The issue now is whether Interactive Brokers Group’s recent share price strength has already reflected its intrinsic value, or if the stock still offers enough valuation support for new investors.
Does Interactive Brokers Group Look Fairly Valued on Excess Returns?
The Excess Returns model for Interactive Brokers Group looks at how much profit the company may generate over and above the return that shareholders could reasonably require on its equity base. For Interactive Brokers Group, the model is anchored on a Book Value of $12.54 per share and a Stable EPS estimate of $6.19 per share, implying an average Return on Equity of 19.85% against a Cost of Equity of $2.88 per share.
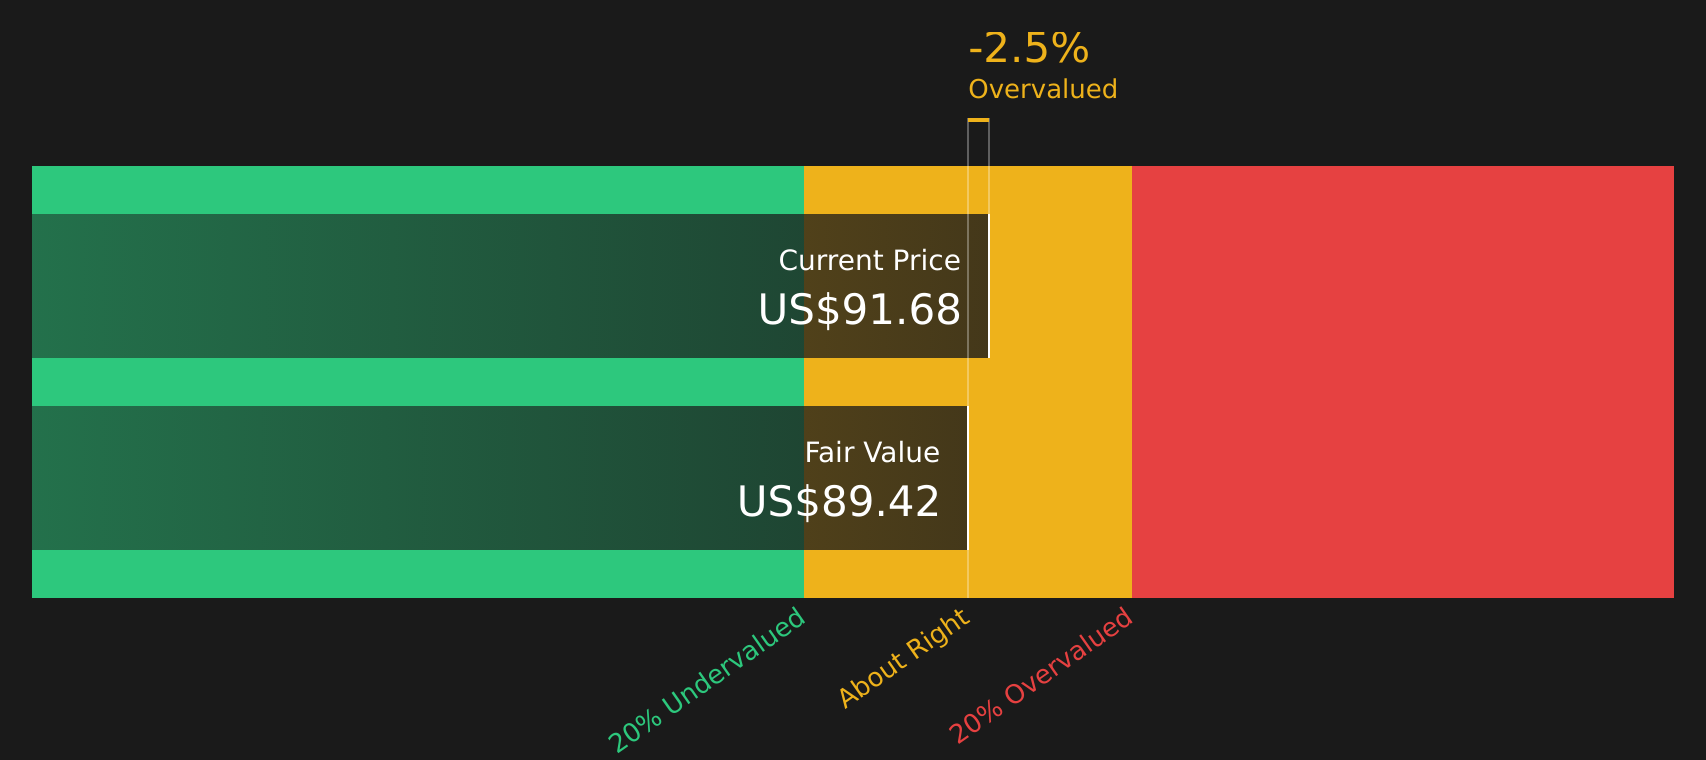
That gap supports an Excess Return of $3.31 per share on a Stable Book Value of $31.17 per share. This rolls up to an intrinsic value estimate of about $89.45 per share, only slightly below the current market price, implying the stock is roughly 1.2% overvalued on this framework. Because the recent South Korean market access and related growth in accounts are already reflected in strong profitability assumptions, the Excess Returns output suggests the recent excitement is largely embedded in today’s price.
On this model, Interactive Brokers Group screens as about fairly valued, with only a small premium to its estimated intrinsic value.
Interactive Brokers Group is fairly valued according to our Excess Returns, but this can change at a moment's notice. Track the value in your watchlist or portfolio and be alerted on when to act.
Is Interactive Brokers Group Getting Expensive on Earnings?
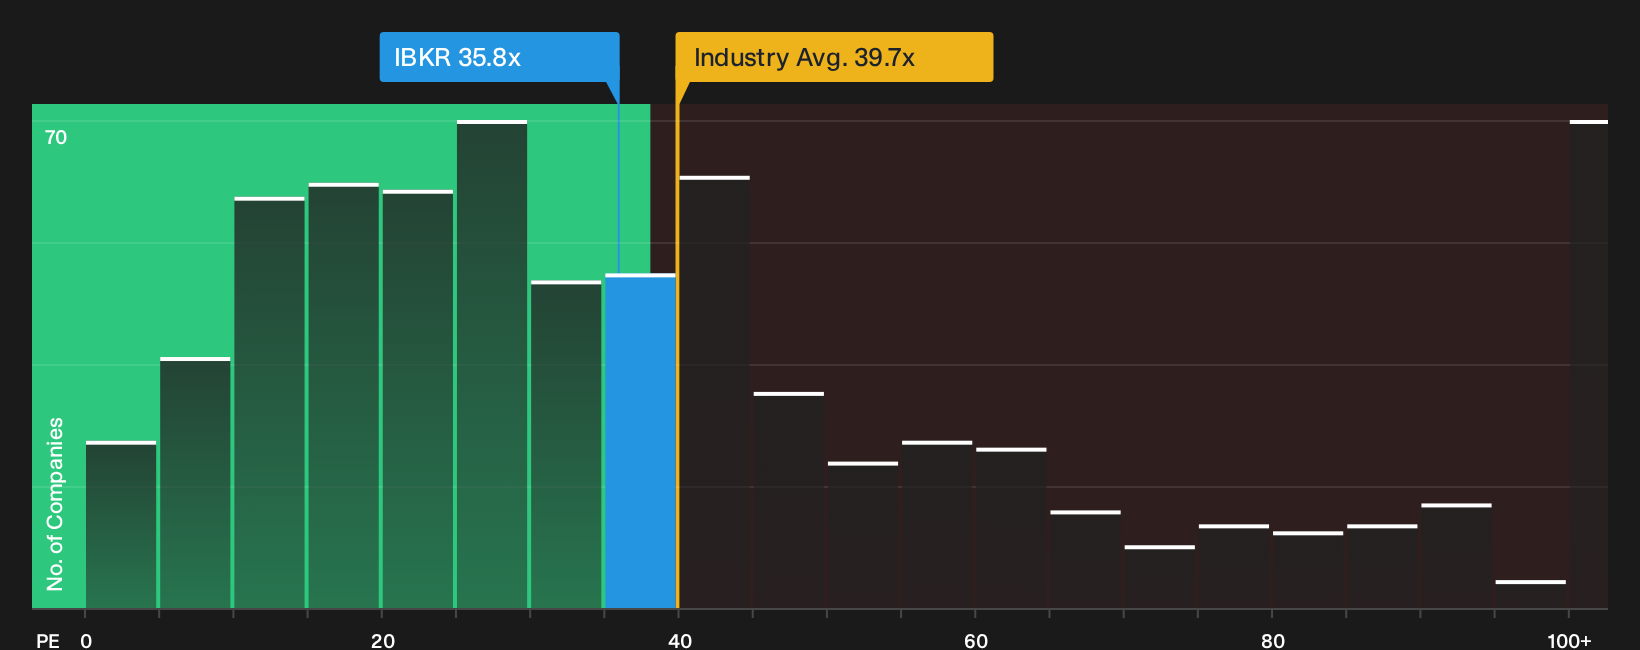
For a profitable broker like Interactive Brokers Group, the P/E ratio is a straightforward way to see how much you are paying for each dollar of earnings. The stock currently trades on about 38.9x earnings, which sits close to the wider Capital Markets industry average of roughly 39.3x but well above the peer group average of about 25.2x.
On Simply Wall St’s fair P/E estimate of 22.3x, which adjusts for Interactive Brokers Group’s size, profitability profile and risk, the current multiple implies a clear premium to what the model suggests would be more reasonable. That gap indicates investors are already paying a higher price for the stock’s business metrics and recent enthusiasm, rather than getting in at a discount.
On the P/E yardstick, Interactive Brokers Group screens as overvalued, with the market asking a higher price for its earnings than the model implies is justified.
See what the numbers say about this price — find out in our valuation breakdown.
The Interactive Brokers Group Narrative: What Would Justify Today's Price?
Simply Wall St Narratives for Interactive Brokers Group pick up where this valuation puzzle leaves off by spelling out which combinations of future growth, margins and earnings would need to hold for the stock to be worth materially more or less than today’s price. Each Narrative ties a fair value to a particular view of Interactive Brokers Group's potential catalysts and risks, so you can see over time which version of the story seems to be unfolding on the Community page.
One of the top community narratives on Interactive Brokers Group: 500% overvalued
"Its platform is engineered to automate most functions, from order routing to risk management, allowing the firm to generate high trading volumes without materially increasing its operating costs…"
Read one of the top narratives on Interactive Brokers Group
Do you think there's more to the story for Interactive Brokers Group? Head over to our Community to see what others are saying!
The Bottom Line
Interactive Brokers Group now screens as roughly fairly valued on the Excess Returns intrinsic value estimate, with only a small premium to that figure, while the P/E multiple points to the stock trading on the expensive side compared with what the tailored fair ratio suggests. The split mainly reflects how the intrinsic value framework focuses on the company’s profitability on its equity base, whereas the earnings multiple leans heavily on strong sentiment and high growth expectations after a very large move in the share price. From here, the key question is whether Interactive Brokers Group can sustain profitability at current levels enough to support that richer earnings multiple.
This article by Simply Wall St is general in nature. We provide commentary based on historical data and analyst forecasts only using an unbiased methodology and our articles are not intended to be financial advice. It does not constitute a recommendation to buy or sell any stock, and does not take account of your objectives, or your financial situation. We aim to bring you long-term focused analysis driven by fundamental data. Note that our analysis may not factor in the latest price-sensitive company announcements or qualitative material. Simply Wall St has no position in any stocks mentioned.
Have feedback on this article? Concerned about the content? Get in touch with us directly. Alternatively, email editorial-team@simplywallst.com