
GLP J-REIT (TSE:3281) Raised 2027 Guidance, Is The Valuation Already Priced In?
Why GLP J-REIT Raised Its 2027 Guidance
GLP J-REIT (TSE:3281) lifted its guidance for operating revenue, income and per unit distributions for the fiscal period ending February 2027, tying the revisions directly to recent portfolio transactions and fresh debt financing.
The company pointed to an asset sale completed earlier in July and the planned acquisition of new logistics properties as key drivers behind the updated assumptions for the coming fiscal period.
See our latest analysis for GLP J-REIT.
At a share price of ¥142,000, GLP J-REIT has seen a 6.69% 1 month share price return and a 15.66% 1 year total shareholder return. The year to date share price return of 4.57% is weaker, which hints that recent momentum is building from a softer start to the year as investors digest the higher guidance, larger portfolio and fresh debt funding.
If the upgraded guidance has you thinking about where else capital could go to work in real assets and infrastructure, this is a useful moment to scan 35 power grid technology and infrastructure stocks
The higher guidance and fresh debt funded acquisitions are now partly reflected in GLP J-REIT's recent rally. The next step is to assess how much of the potential upside is still ahead versus already priced in.
Price-To-Earnings Of 22x For GLP J-REIT: Is It Justified?
On a P/E of 22x, GLP J-REIT is being valued at a slightly higher multiple than its own estimated fair P/E ratio of 20.7x, even though its share price of ¥142,000 sits below some peers in the Industrial REITs space.
The P/E multiple compares the current share price to earnings per unit, so it essentially reflects how much investors are willing to pay today for each unit of current earnings. For a logistics focused J-REIT such as GLP J-REIT, that lens is often used as a shorthand for expectations around rental income stability, acquisition activity and how efficiently earnings are being converted from the asset base.
Relative to peers, the picture is mixed. GLP J-REIT's 22x P/E is below the peer average of 26.3x, which suggests investors are paying less for its earnings than for the average company in its peer group. However, the same 22x multiple is above the Asian Industrial REITs industry average of 16.5x and above the estimated fair P/E of 20.7x, pointing to a valuation that sits between sector average and peer enthusiasm, at a level the market could still adjust toward over time.
Explore the SWS fair ratio for GLP J-REIT
Result: Price-to-Earnings of 22x (OVERVALUED)
However, GLP J-REIT's higher P/E and recent debt funding could face pressure if rental demand softens or acquisition performance does not match current expectations.
Find out about the key risks to this GLP J-REIT narrative.
Another View On GLP J-REIT's Valuation
The picture changes when shifting from the P/E lens to the SWS DCF model. On this view, GLP J-REIT at ¥142,000 is trading above an estimated future cash flow value of ¥90,973.33, which points to an overvalued share price based on projected cash generation rather than current earnings.
This gap between earnings-based valuation and the cash flow view raises a simple question for investors: which signal feels more reliable for GLP J-REIT at this point in the cycle?
Look into how the SWS DCF model arrives at its fair value.
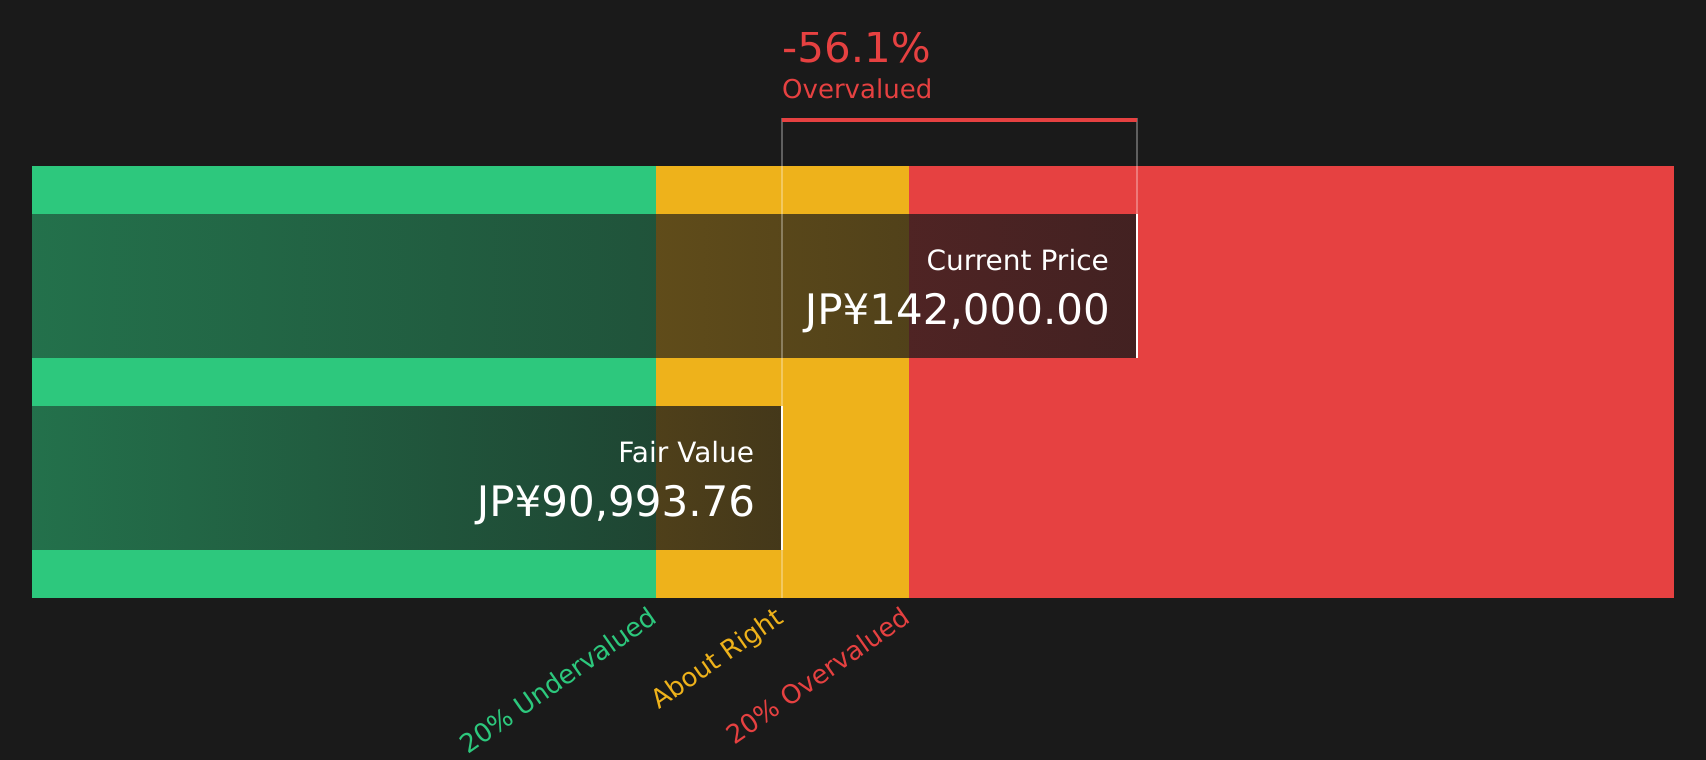
Simply Wall St performs a discounted cash flow (DCF) on every stock in the world every day (check out GLP J-REIT for example). We show the entire calculation in full. You can track the result in your watchlist or portfolio and be alerted when this changes, or use our stock screener to discover 17 high quality undervalued stocks. If you save a screener we even alert you when new companies match - so you never miss a potential opportunity.
Next Steps
With GLP J-REIT showing both concerns and reasons for optimism, do you want to rely on headlines or your own judgment? To weigh the balance of potential risks and rewards for yourself, start with the 2 key rewards and 3 important warning signs.
Looking For More Investment Ideas Beyond GLP J-REIT?
If GLP J-REIT has sharpened your focus on where capital works hardest, do not stop here. Broaden your watchlist while the market is still offering options.
- Spot opportunities that combine quality, value and cash generation by scanning 17 high quality undervalued stocks before the crowd chases the same ideas.
- Strengthen the income side of your portfolio by reviewing 46 dividend fortresses while payout levels and yields are still available at current prices.
- Protect your downside by filtering for resilience with the 51 resilient stocks with low risk scores so you are not caught off guard when conditions change.
This article by Simply Wall St is general in nature. We provide commentary based on historical data and analyst forecasts only using an unbiased methodology and our articles are not intended to be financial advice. It does not constitute a recommendation to buy or sell any stock, and does not take account of your objectives, or your financial situation. We aim to bring you long-term focused analysis driven by fundamental data. Note that our analysis may not factor in the latest price-sensitive company announcements or qualitative material. Simply Wall St has no position in any stocks mentioned.
Have feedback on this article? Concerned about the content? Get in touch with us directly. Alternatively, email editorial-team@simplywallst.com