
3 Global Stocks Estimated To Be Undervalued By Up To 49.6%
Amidst the backdrop of mixed performances in global markets, with volatility driven by Middle East tensions and fluctuating oil prices, investors are increasingly focused on identifying opportunities within sectors showing resilience. In such an environment, undervalued stocks can present potential value, especially when market conditions highlight discrepancies between a company's intrinsic worth and its current market price.
Top 10 Undervalued Stocks Based On Cash Flows
| Name | Current Price | Fair Value (Est) | Discount (Est) |
| SHIFT (TSE:3697) | ¥745.10 | ¥1478.95 | 49.6% |
| Rakus (TSE:3923) | ¥1020.50 | ¥2033.06 | 49.8% |
| Pan-United (SGX:P52) | SGD1.59 | SGD3.14 | 49.4% |
| Nippon Thompson (TSE:6480) | ¥1759.00 | ¥3506.41 | 49.8% |
| Lotes (TWSE:3533) | NT$1865.00 | NT$3660.65 | 49.1% |
| Laopu Gold (SEHK:6181) | HK$373.40 | HK$745.96 | 49.9% |
| Fuji (TSE:6134) | ¥7291.00 | ¥14448.74 | 49.5% |
| Dynavox Group (OM:DYVOX) | SEK66.20 | SEK130.59 | 49.3% |
| CDON (OM:CDON) | SEK61.00 | SEK119.75 | 49.1% |
| AUTO1 Group (XTRA:AG1) | €26.12 | €52.18 | 49.9% |
We'll examine a selection from our screener results.
China XLX Fertiliser (SEHK:1866)
Overview: China XLX Fertiliser Ltd. is an investment holding company involved in the development, manufacture, and sale of urea both in Mainland China and internationally, with a market capitalization of HK$12.78 billion.
Operations: The company's revenue segments include Fertilizer - Urea (CN¥9.71 billion), Fertilizer - Compound Fertilizer (CN¥8.47 billion), Chemicals - Methanol (CN¥6.84 billion), Chemicals - Liquid Ammonia (CN¥2.61 billion), Chemicals - DMF (CN¥1.12 billion), Chemicals - Melamine (CN¥0.88 billion), and Chemicals - Polyoxymethylene (CN¥0.41 billion).
Estimated Discount To Fair Value: 45.1%
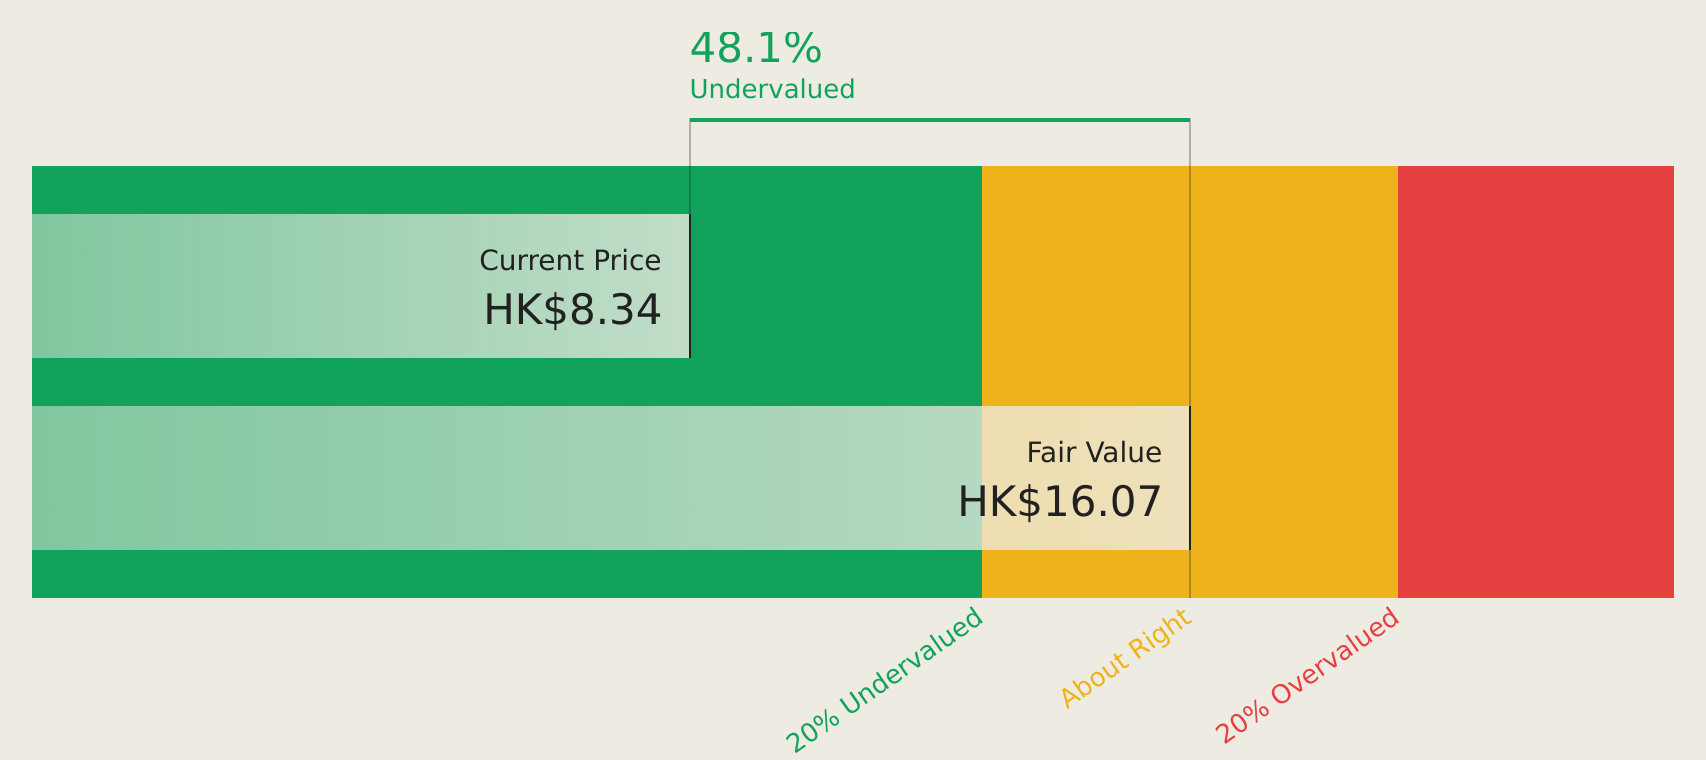
China XLX Fertiliser is trading at HK$8.81, significantly below its estimated future cash flow value of HK$16.06, indicating it may be undervalued based on cash flows. Despite a decline in profit margins from 6.3% to 3.7%, earnings are projected to grow at 25.45% annually over the next three years, outpacing the Hong Kong market's growth rate of 12.6%. However, high debt levels and unsustainable dividends pose potential risks for investors seeking value opportunities in this stock.
- Our expertly prepared growth report on China XLX Fertiliser implies its future financial outlook may be stronger than recent results.
- Click here and access our complete balance sheet health report to understand the dynamics of China XLX Fertiliser.
SHIFT (TSE:3697)
Overview: SHIFT Inc. offers software quality assurance and testing solutions in Japan, with a market cap of ¥173.76 billion.
Operations: The company generates revenue from software testing related services amounting to ¥96.96 billion and software development related services totaling ¥46.30 billion.
Estimated Discount To Fair Value: 49.6%
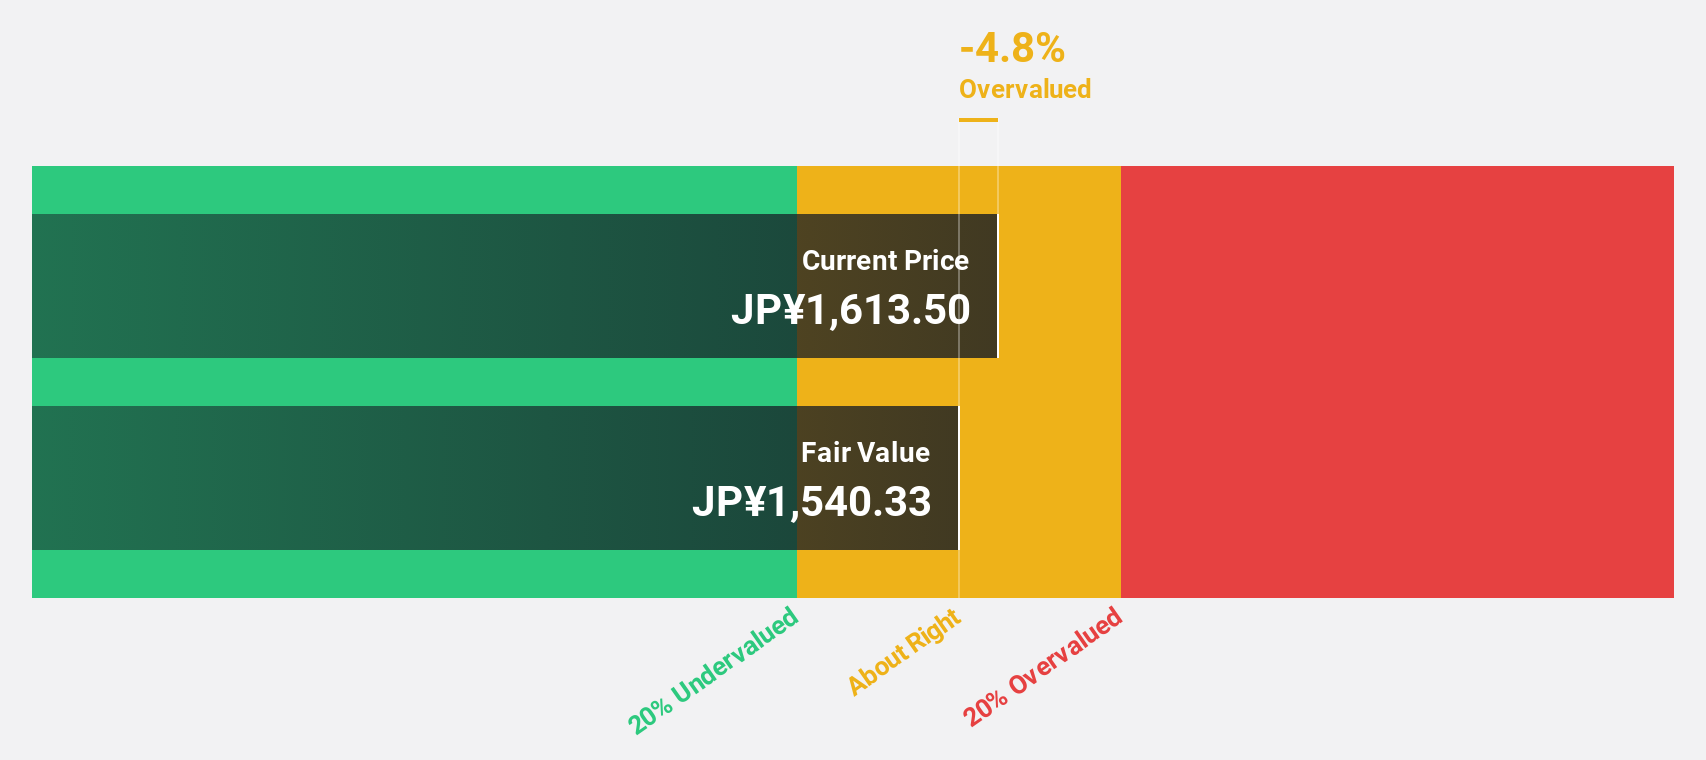
SHIFT Inc. is trading at ¥745.1, well below its estimated future cash flow value of ¥1478.95, highlighting potential undervaluation based on cash flows. While the company faces challenges with declining profit margins from 6.5% to 4.4%, earnings are forecasted to grow significantly at 37.9% annually over the next three years, surpassing Japan's market growth rate of 10.1%. However, recent guidance revisions and share price volatility may concern investors seeking stability in cash flow-driven investments.
- Insights from our recent growth report point to a promising forecast for SHIFT's business outlook.
- Click here to discover the nuances of SHIFT with our detailed financial health report.
Recruit Holdings (TSE:6098)
Overview: Recruit Holdings Co., Ltd. offers HR technology and business solutions aimed at transforming the world of work, with a market cap of approximately ¥17.52 trillion.
Operations: The company's revenue is segmented into Staffing at ¥1.70 billion, HR Technology at ¥1.46 billion, and Marketing Matching Technologies at ¥564.66 million.
Estimated Discount To Fair Value: 41.7%
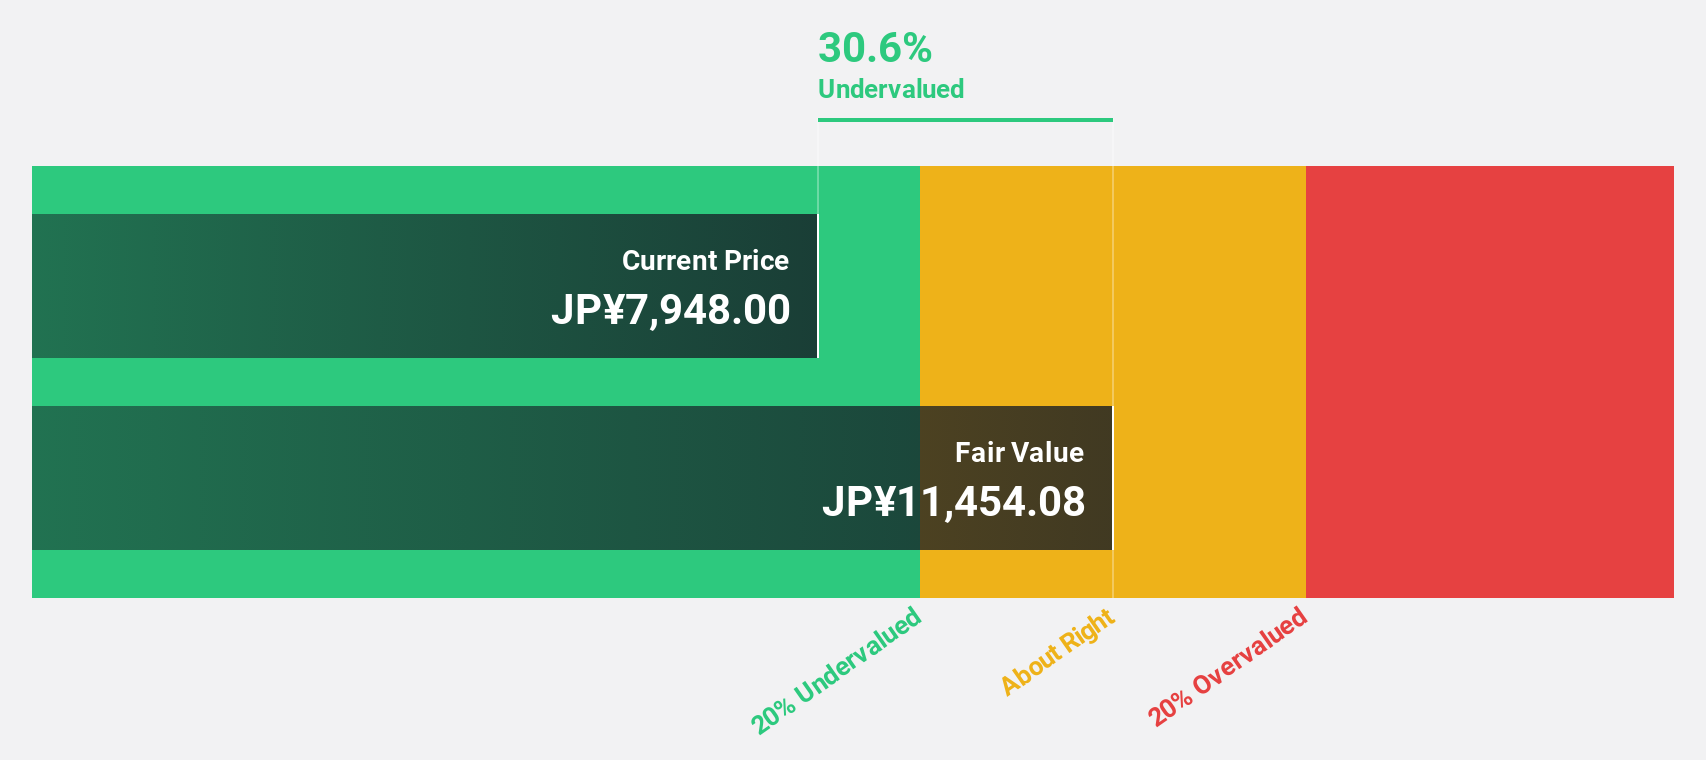
Recruit Holdings is trading at ¥12,740, significantly below its estimated future cash flow value of ¥21,852.52, suggesting undervaluation based on cash flows. The company forecasts 13.6% annual earnings growth and a high return on equity of 40.5% in three years. Recent buybacks totaling ¥52.4 billion improve shareholder value despite share price volatility and moderate revenue growth projections at 6.5%, aligning with the Japanese market rate.
- Our earnings growth report unveils the potential for significant increases in Recruit Holdings' future results.
- Dive into the specifics of Recruit Holdings here with our thorough financial health report.
Key Takeaways
- Dive into all 420 of the Undervalued Global Stocks Based On Cash Flows we have identified here.
- Are these companies part of your investment strategy? Use Simply Wall St to consolidate your holdings into a portfolio and gain insights with our comprehensive analysis tools.
- Simply Wall St is your key to unlocking global market trends, a free user-friendly app for forward-thinking investors.
Want To Explore Some Alternatives?
- Explore high-performing small cap companies that haven't yet garnered significant analyst attention.
- Diversify your portfolio with solid dividend payers offering reliable income streams to weather potential market turbulence.
- Fuel your portfolio with companies showing strong growth potential, backed by optimistic outlooks both from analysts and management.
This article by Simply Wall St is general in nature. We provide commentary based on historical data and analyst forecasts only using an unbiased methodology and our articles are not intended to be financial advice. It does not constitute a recommendation to buy or sell any stock, and does not take account of your objectives, or your financial situation. We aim to bring you long-term focused analysis driven by fundamental data. Note that our analysis may not factor in the latest price-sensitive company announcements or qualitative material. Simply Wall St has no position in any stocks mentioned.
Have feedback on this article? Concerned about the content? Get in touch with us directly. Alternatively, email editorial-team@simplywallst.com