
Global's Top 3 Dividend Stocks To Enhance Your Portfolio
In a week marked by geopolitical tensions and energy market volatility, global markets showed mixed performance, with U.S. indices like the Nasdaq and S&P 500 gaining ground while others such as the Dow Jones Industrial Average faced declines. Amid these fluctuations, investors often turn to dividend stocks as a strategy to enhance portfolio stability and generate income, especially in uncertain economic environments where consistent returns are valued.
Top 10 Dividend Stocks Globally
| Name | Dividend Yield | Dividend Rating |
| Yeni Gimat Gayrimenkul Yatirim Ortakligi (IBSE:YGGYO) | 3.19% | ★★★★★★ |
| Telekom Austria (WBAG:TKA) | 4.20% | ★★★★★★ |
| System ResearchLtd (TSE:3771) | 3.90% | ★★★★★★ |
| Swiss Re (SWX:SREN) | 4.76% | ★★★★★★ |
| SIGMAXYZ Holdings (TSE:6088) | 4.52% | ★★★★★★ |
| Sakai Moving ServiceLtd (TSE:9039) | 3.93% | ★★★★★★ |
| OUG Holdings (TSE:8041) | 3.85% | ★★★★★★ |
| NCD (TSE:4783) | 4.89% | ★★★★★★ |
| Business Brain Showa-Ota (TSE:9658) | 4.58% | ★★★★★★ |
| Binggrae (KOSE:A005180) | 5.10% | ★★★★★★ |
Click here to see the full list of 1376 stocks from our Top Global Dividend Stocks screener.
Let's take a closer look at a couple of our picks from the screened companies.
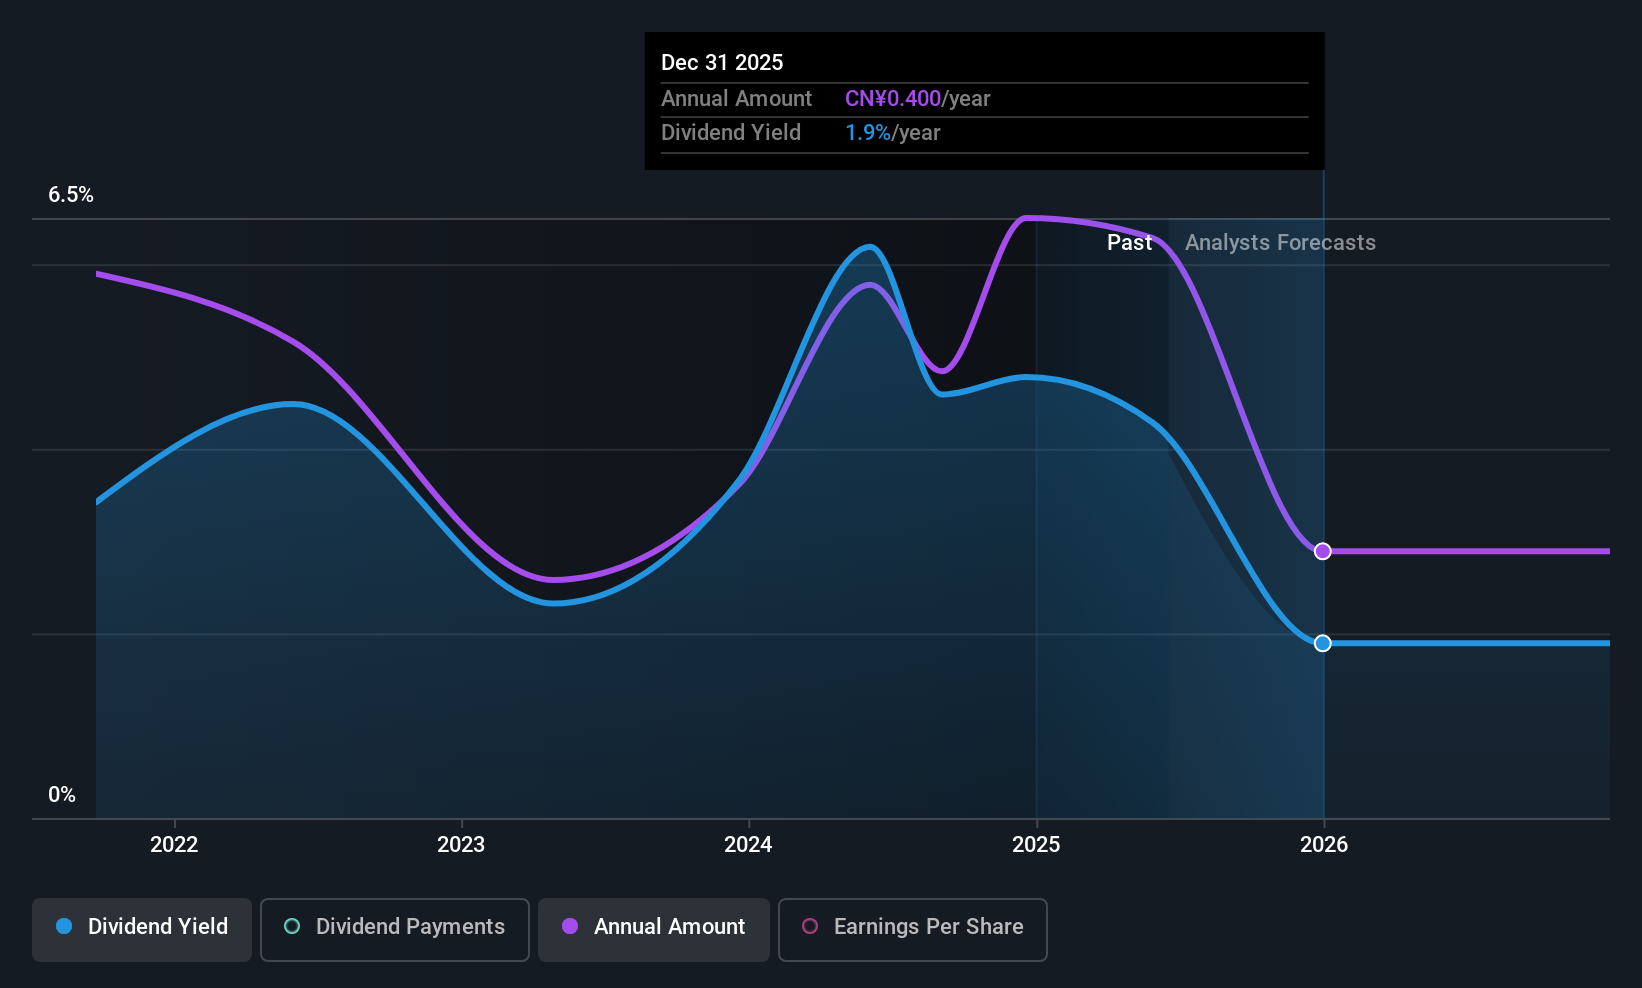
Tianjin Yiyi Hygiene ProductsLtd (SZSE:001206)
Simply Wall St Dividend Rating: ★★★★☆☆
Overview: Tianjin Yiyi Hygiene Products Co., Ltd, along with its subsidiaries, focuses on the research, development, production, and sale of disposable hygiene products and non-woven fabrics both in China and internationally, with a market cap of CN¥3.90 billion.
Operations: Tianjin Yiyi Hygiene Products Co., Ltd generates revenue through its core activities in the disposable hygiene products and non-woven fabrics sectors, serving both domestic and international markets.
Dividend Yield: 3.4%
Tianjin Yiyi Hygiene Products Ltd.'s dividend is covered by earnings and cash flows, with payout ratios of 88.6% and 77.6%, respectively. However, its dividend history is unstable, having been paid for only five years with volatility exceeding a 20% annual drop. Despite this, the current yield of 3.4% ranks in the top quartile of CN market payers. Recent changes to company bylaws could impact future operations and governance but don't directly affect dividends yet.
- Dive into the specifics of Tianjin Yiyi Hygiene ProductsLtd here with our thorough dividend report.
- Our expertly prepared valuation report Tianjin Yiyi Hygiene ProductsLtd implies its share price may be lower than expected.
Daoming Optics&ChemicalLtd (SZSE:002632)
Simply Wall St Dividend Rating: ★★★★★☆
Overview: Daoming Optics&Chemical Ltd specializes in the R&D, production, and sale of functional films and polymer synthetic materials both domestically and internationally, with a market cap of CN¥6.01 billion.
Operations: Daoming Optics&Chemical Ltd generates revenue from its core activities in the development and sale of functional films and polymer synthetic materials across domestic and international markets.
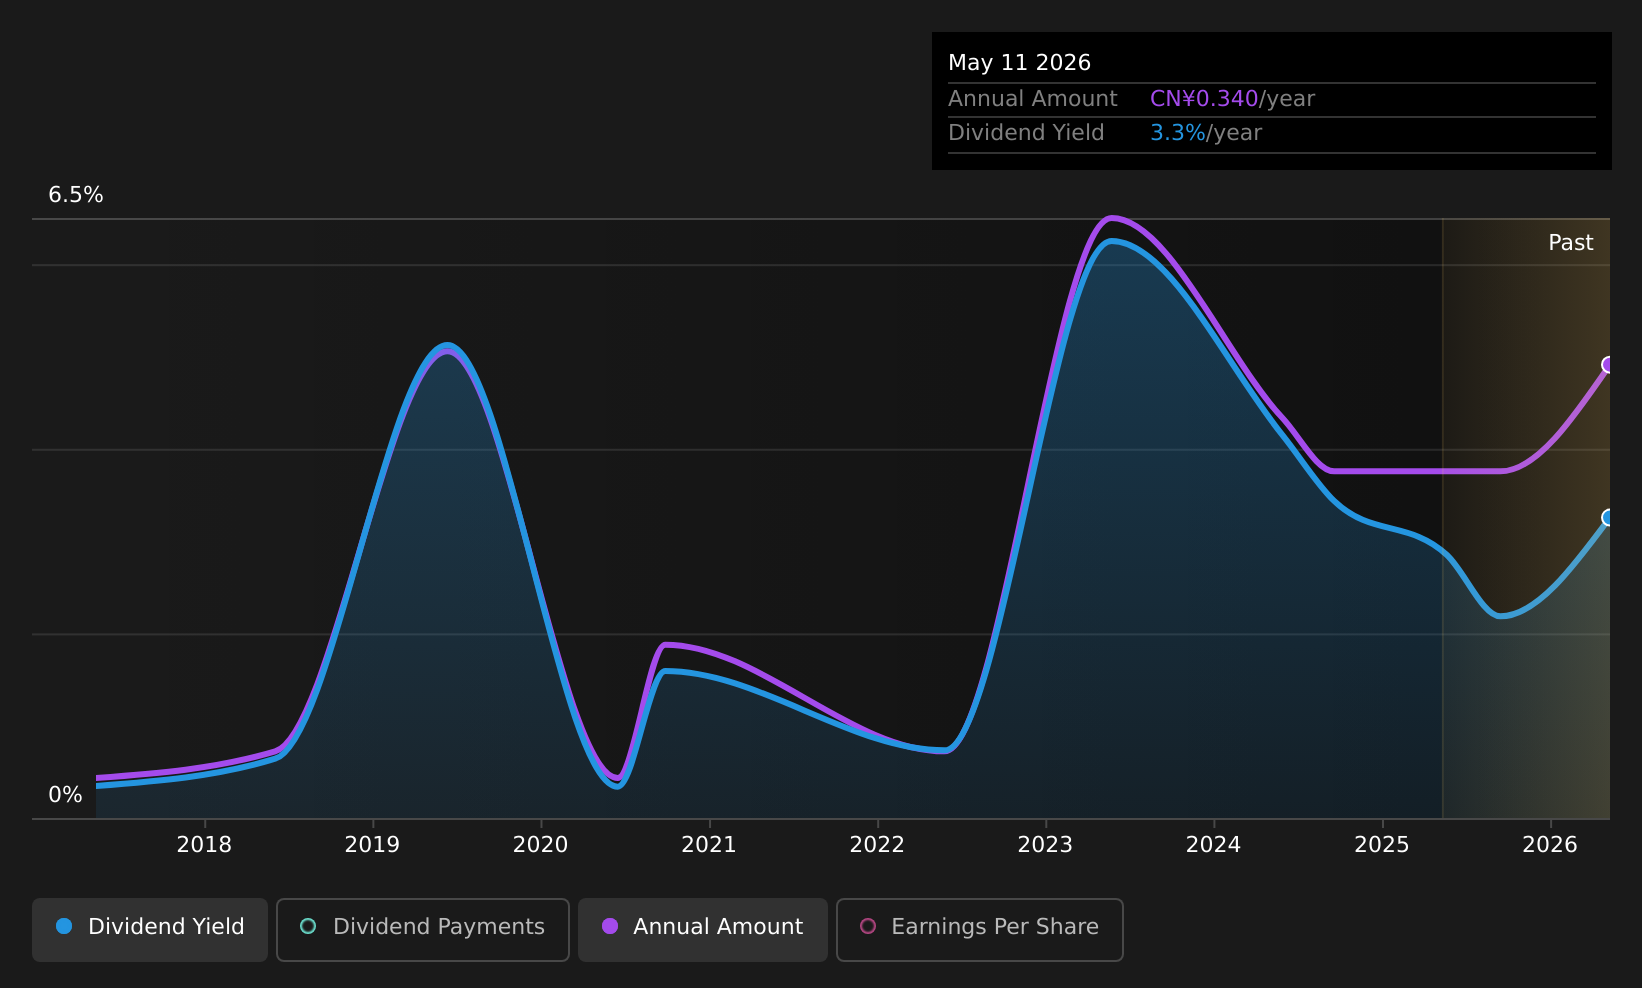
Dividend Yield: 3.2%
Daoming Optics&Chemical Ltd.'s dividend yield of 3.21% places it among the top 25% of CN market payers, though its dividend history has been volatile over the past decade with significant annual drops. The company's dividends are covered by earnings and cash flows, with payout ratios at 90% and 57.4%, respectively. Despite a recent decline in Q1 earnings to CNY 41 million from CNY 51.45 million last year, dividends remain supported by cash flow coverage.
- Click here to discover the nuances of Daoming Optics&ChemicalLtd with our detailed analytical dividend report.
- The analysis detailed in our Daoming Optics&ChemicalLtd valuation report hints at an deflated share price compared to its estimated value.
Bank of Suzhou (SZSE:002966)
Simply Wall St Dividend Rating: ★★★★☆☆
Overview: Bank of Suzhou Co., Ltd. offers commercial banking products and services in China, with a market cap of CN¥35.27 billion.
Operations: Bank of Suzhou Co., Ltd. generates revenue through its diverse range of commercial banking products and services in China.
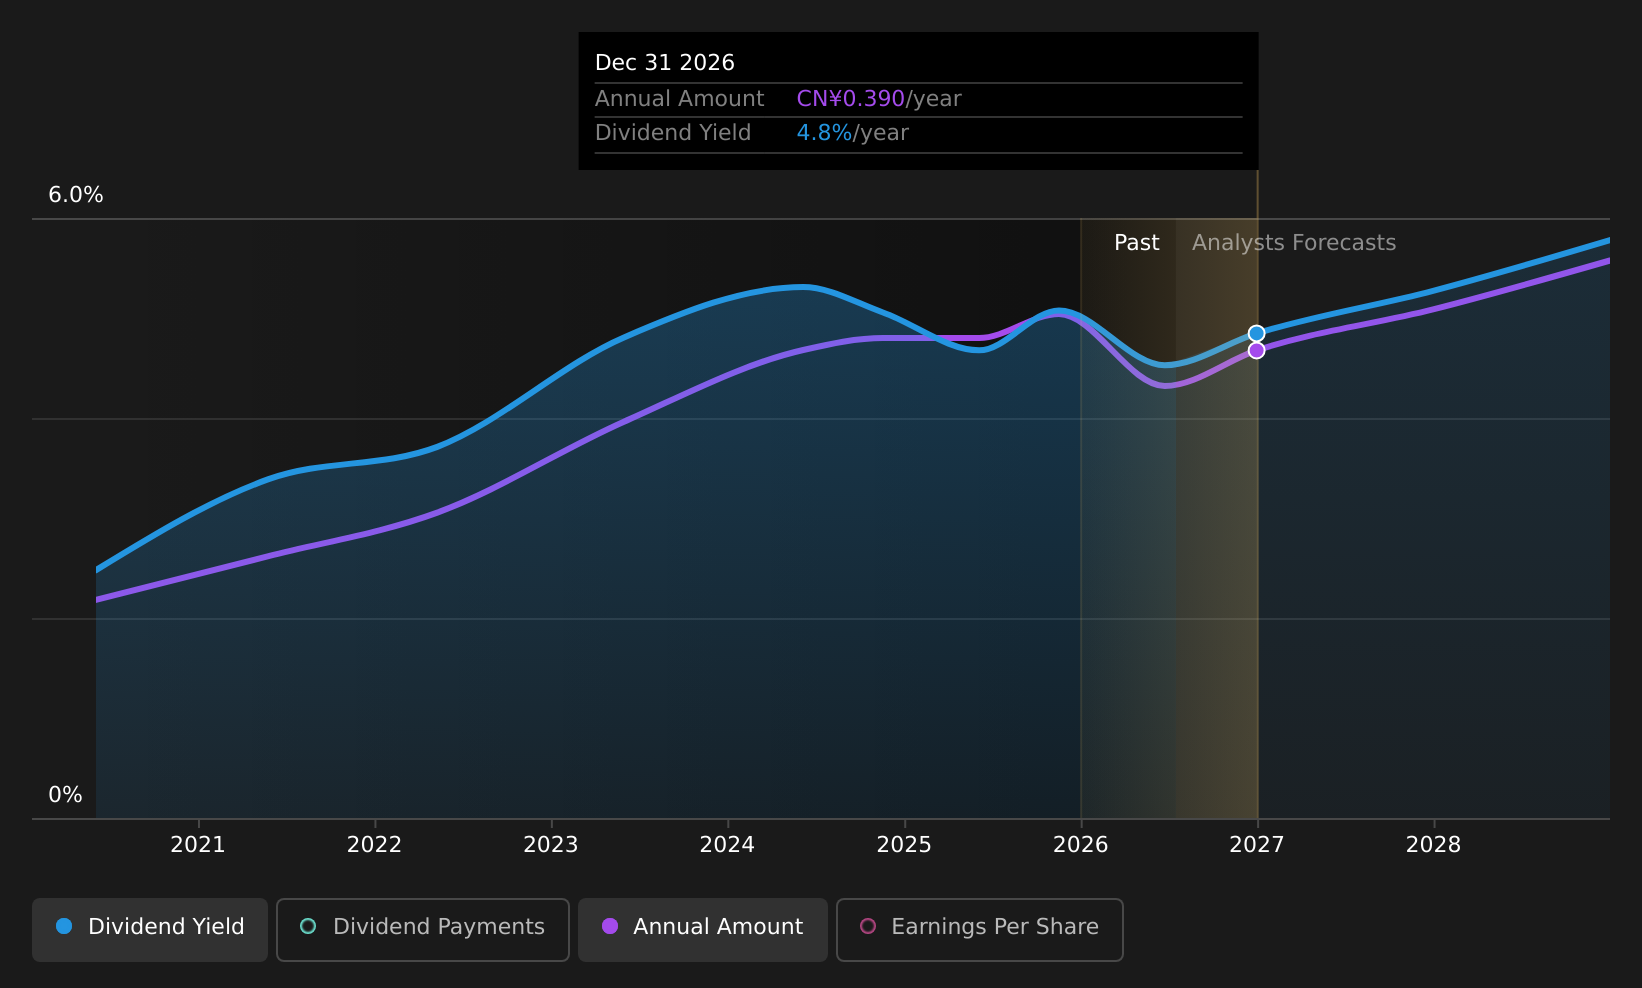
Dividend Yield: 4.5%
Bank of Suzhou's dividend yield of 4.48% ranks it in the top 25% of CN market payers, despite a volatile six-year history with recent decreases. Its dividends are well covered by earnings, with a payout ratio at 31.2%, and forecasted to remain sustainable at 30.4%. Recent Q1 results showed net income growth to CNY 1.68 billion from CNY 1.55 billion last year, supporting its dividend coverage amid price undervaluation concerns.
- Delve into the full analysis dividend report here for a deeper understanding of Bank of Suzhou.
- The valuation report we've compiled suggests that Bank of Suzhou's current price could be quite moderate.
Seize The Opportunity
- Dive into all 1376 of the Top Global Dividend Stocks we have identified here.
- Are you invested in these stocks already? Keep abreast of every twist and turn by setting up a portfolio with Simply Wall St, where we make it simple for investors like you to stay informed and proactive.
- Simply Wall St is a revolutionary app designed for long-term stock investors, it's free and covers every market in the world.
Searching for a Fresh Perspective?
- Explore high-performing small cap companies that haven't yet garnered significant analyst attention.
- Fuel your portfolio with companies showing strong growth potential, backed by optimistic outlooks both from analysts and management.
- Find companies with promising cash flow potential yet trading below their fair value.
This article by Simply Wall St is general in nature. We provide commentary based on historical data and analyst forecasts only using an unbiased methodology and our articles are not intended to be financial advice. It does not constitute a recommendation to buy or sell any stock, and does not take account of your objectives, or your financial situation. We aim to bring you long-term focused analysis driven by fundamental data. Note that our analysis may not factor in the latest price-sensitive company announcements or qualitative material. Simply Wall St has no position in any stocks mentioned.
Have feedback on this article? Concerned about the content? Get in touch with us directly. Alternatively, email editorial-team@simplywallst.com