
Undiscovered Gems in Global Markets to Explore This July 2026
As global markets navigate the complexities of Middle East tensions and energy market volatility, the performance of major indices has been mixed, with growth stocks outpacing their value counterparts. In this environment, small-cap stocks like those in the Russell 2000 Index have faced challenges, yet they remain a fertile ground for discovering promising opportunities that may be overlooked by larger investors. Identifying a good stock often involves looking at companies with robust fundamentals and innovative strategies that can thrive even amid broader market uncertainties.
Top 10 Undiscovered Gems With Strong Fundamentals Globally
| Name | Debt To Equity | Revenue Growth | Earnings Growth | Health Rating |
|---|---|---|---|---|
| CNMC Goldmine Holdings | 0.84% | 32.52% | 78.36% | ★★★★★★ |
| DeHua TB New Decoration MaterialLtd | 0.63% | 1.50% | 2.14% | ★★★★★★ |
| Nippon Carbide Industries | 16.74% | 1.99% | -4.81% | ★★★★★★ |
| Base | NA | 11.66% | 17.63% | ★★★★★★ |
| GROUPE SFPI | 18.02% | 4.25% | -29.76% | ★★★★★★ |
| Angler Gaming | NA | -5.12% | -24.26% | ★★★★★★ |
| Zhejiang Jolly PharmaceuticalLTD | 21.31% | 17.83% | 29.70% | ★★★★★☆ |
| Sing Investments & Finance | 0.15% | 7.06% | 8.65% | ★★★★☆☆ |
| Shengda ResourcesLtd | 54.08% | 7.99% | 3.75% | ★★★☆☆☆ |
| Regina Miracle International (Holdings) | 132.81% | 0.48% | -15.87% | ★★★☆☆☆ |
Here we highlight a subset of our preferred stocks from the screener.
Storskogen Group (OM:STOR B)
Simply Wall St Value Rating: ★★★★★★
Overview: Storskogen Group AB (publ) is a company that owns and develops small and medium-sized businesses across trade, industry, and services sectors, with a market capitalization of approximately SEK16.16 billion.
Operations: Storskogen Group generates its revenue primarily from its Industry, Trade, and Services segments, with SEK14.30 billion from Industry and SEK9.51 billion from Trade. The Services segment contributes SEK9.25 billion to the revenue stream.
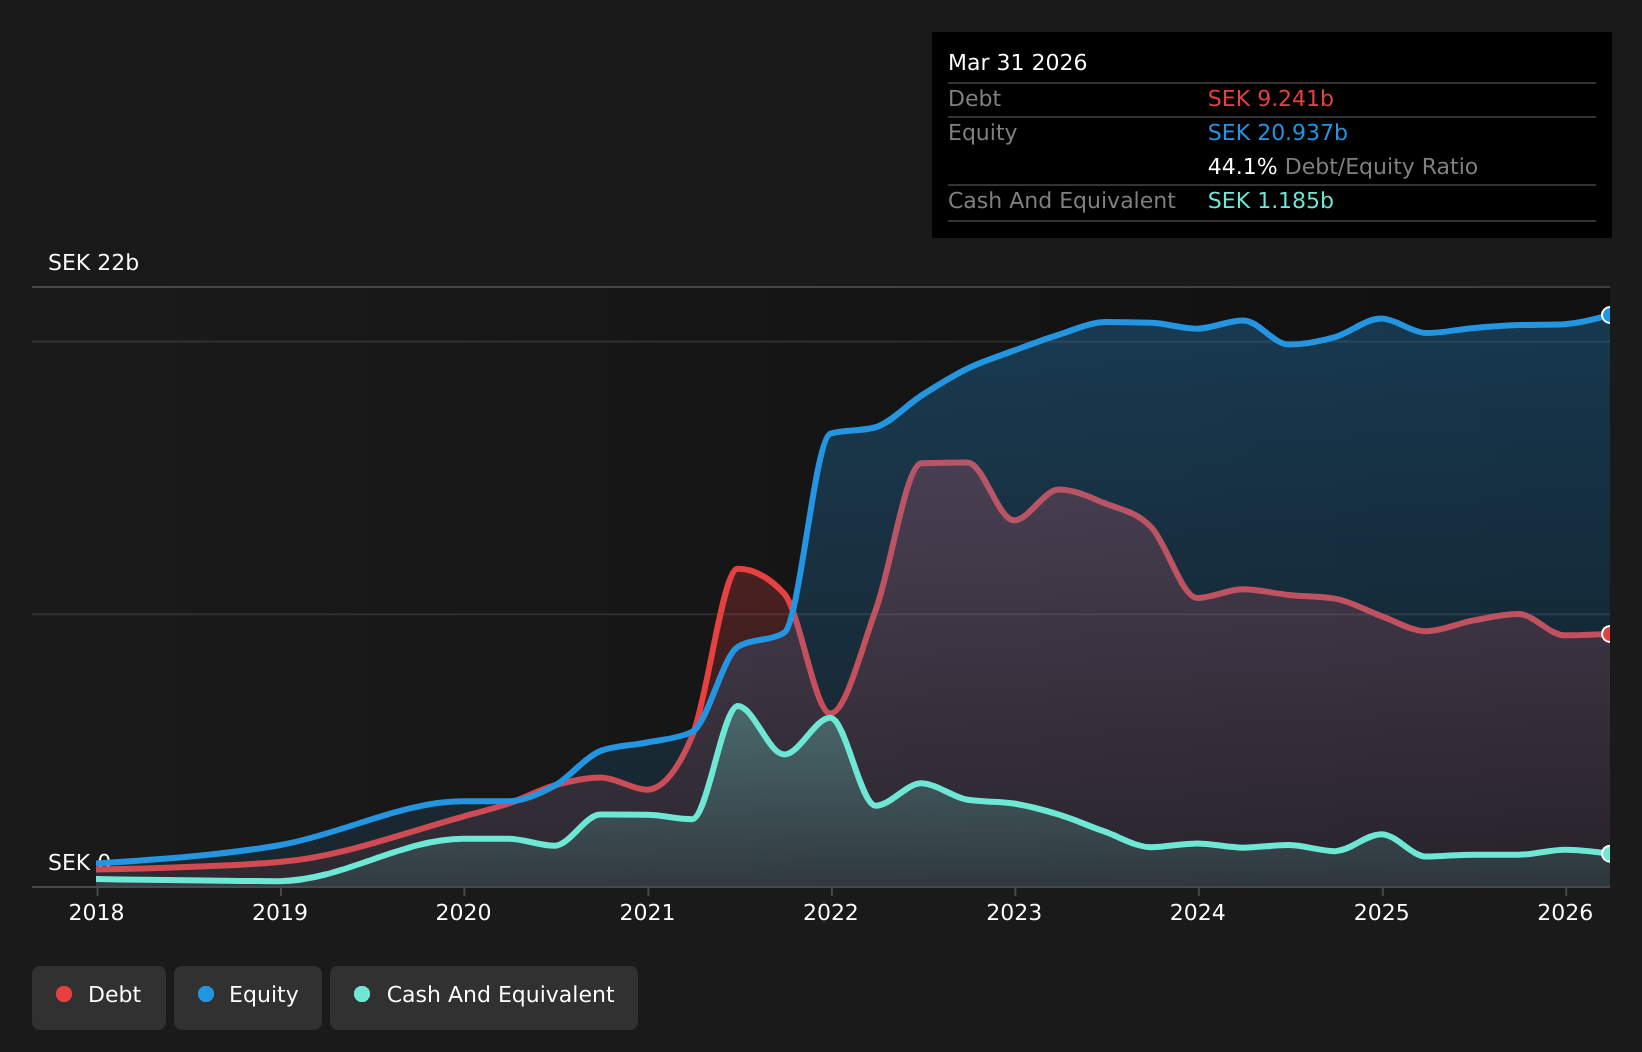
Storskogen Group, a nimble player in the industrial services sector, has seen impressive earnings growth of 3803.8% over the past year. The company’s net debt to equity ratio stands at a satisfactory 38.5%, and it has successfully reduced this from 97.2% over five years, reflecting prudent financial management. Despite a significant one-off loss of SEK1.7 billion impacting recent results, Storskogen trades at an attractive value—71.5% below fair estimates—and maintains strong EBIT coverage for interest payments (6x). Looking ahead, analysts forecast continued revenue growth in digital healthcare and industrial services sectors amid potential market challenges.
Vector (TSE:6058)
Simply Wall St Value Rating: ★★★★★★
Overview: Vector Inc. operates in public relations, advertising, press release and video distribution, direct marketing, media, investment, and human resources sectors across Japan, China, and internationally with a market capitalization of ¥80.02 billion.
Operations: Vector generates revenue through its diverse operations in PR, advertising, media distribution, direct marketing, investment, and human resources across multiple regions. The company reported a gross profit margin of 53.5% in the latest financial period.
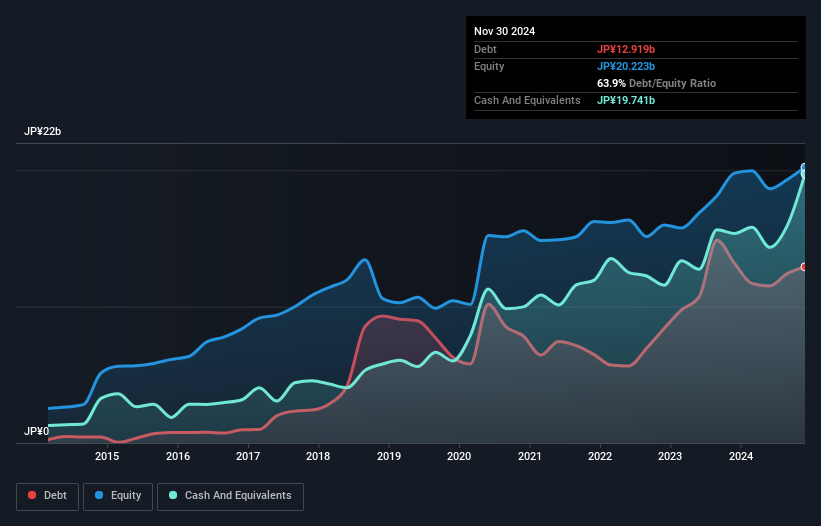
Vector Inc. stands out with its robust financial footing, boasting a debt to equity ratio that has improved from 50% to 29.8% over five years, indicating prudent management of leverage. The company's interest payments are comfortably covered by EBIT at 351.8x, showcasing strong earnings capability relative to debt obligations. Recent guidance revisions reveal expected net sales of JPY 32,600 million and operating profit of JPY 4,640 million for the first half of fiscal year ending August 2026, reflecting strategic profit recognition adjustments within the year. Trading at a significant discount to fair value estimates further enhances its appeal as an investment opportunity in the media sector.
Eson Precision Ind (TWSE:5243)
Simply Wall St Value Rating: ★★★★★☆
Overview: Eson Precision Ind. Co., Ltd. is engaged in the production and sale of molds and consumer electronic components, serving both domestic and international markets, with a market capitalization of NT$16.18 billion.
Operations: Eson Precision Ind. generates revenue primarily from its mold, plastic, and metal products segment, which accounts for NT$11.84 billion.
Eson Precision Ind. shines with earnings growth of 29.7%, outpacing the Electronic industry's -4% slump, and forecasts suggest a robust 40.18% annual increase ahead. Despite a slight rise in its debt to equity ratio from 11.6 to 12.8 over five years, the company’s interest payments are comfortably covered by EBIT at an impressive 45.6 times coverage, indicating solid financial health. With net income climbing to TWD 247 million from TWD 168 million year-on-year, Eson appears undervalued by about 81%, offering potential upside for investors seeking value in this dynamic sector.
- Navigate through the intricacies of Eson Precision Ind with our comprehensive health report here.
Gain insights into Eson Precision Ind's past trends and performance with our Past report.

Taking Advantage
- Explore the 151 names from our Global Undiscovered Gems With Strong Fundamentals screener here.
- Already own these companies? Bring clarity to your investment decisions by linking up your portfolio with Simply Wall St, where you can monitor all the vital signs of your stocks effortlessly.
- Simply Wall St is your key to unlocking global market trends, a free user-friendly app for forward-thinking investors.
Ready To Venture Into Other Investment Styles?
- Explore high-performing small cap companies that haven't yet garnered significant analyst attention.
- Fuel your portfolio with companies showing strong growth potential, backed by optimistic outlooks both from analysts and management.
- Find companies with promising cash flow potential yet trading below their fair value.
This article by Simply Wall St is general in nature. We provide commentary based on historical data and analyst forecasts only using an unbiased methodology and our articles are not intended to be financial advice. It does not constitute a recommendation to buy or sell any stock, and does not take account of your objectives, or your financial situation. We aim to bring you long-term focused analysis driven by fundamental data. Note that our analysis may not factor in the latest price-sensitive company announcements or qualitative material. Simply Wall St has no position in any stocks mentioned.
Have feedback on this article? Concerned about the content? Get in touch with us directly. Alternatively, email editorial-team@simplywallst.com