
Is Union Pacific (UNP) Fairly Valued With Merger Upside Priced In?
Union Pacific stock has delivered a 52.7% return over the past five years, and at around US$299 per share the valuation signals are now more finely balanced, with the Discounted Cash Flow (DCF) intrinsic value estimate indicating the shares are roughly in line with fair value while earnings based multiples still screen as attractive.
- Over the last 5 years, a 52.7% return suggests Union Pacific has already rewarded long term holders. Fresh buyers need to think carefully about how much upside is left from here.
- The proposed US$85b merger with Norfolk Southern may support longer term revenue and cost synergies if it proceeds as planned. Regulatory scrutiny and potential divestments could limit how much value ultimately flows through to shareholders.
- Union Pacific scores 3 out of 6 on the valuation checks, which points to a mixed picture rather than a clear bargain or clear overvaluation.
The issue now is whether Union Pacific’s current price fairly reflects its intrinsic value or still leaves a margin of safety for new investors.
Does Union Pacific Look Fairly Valued on Cash Flow?
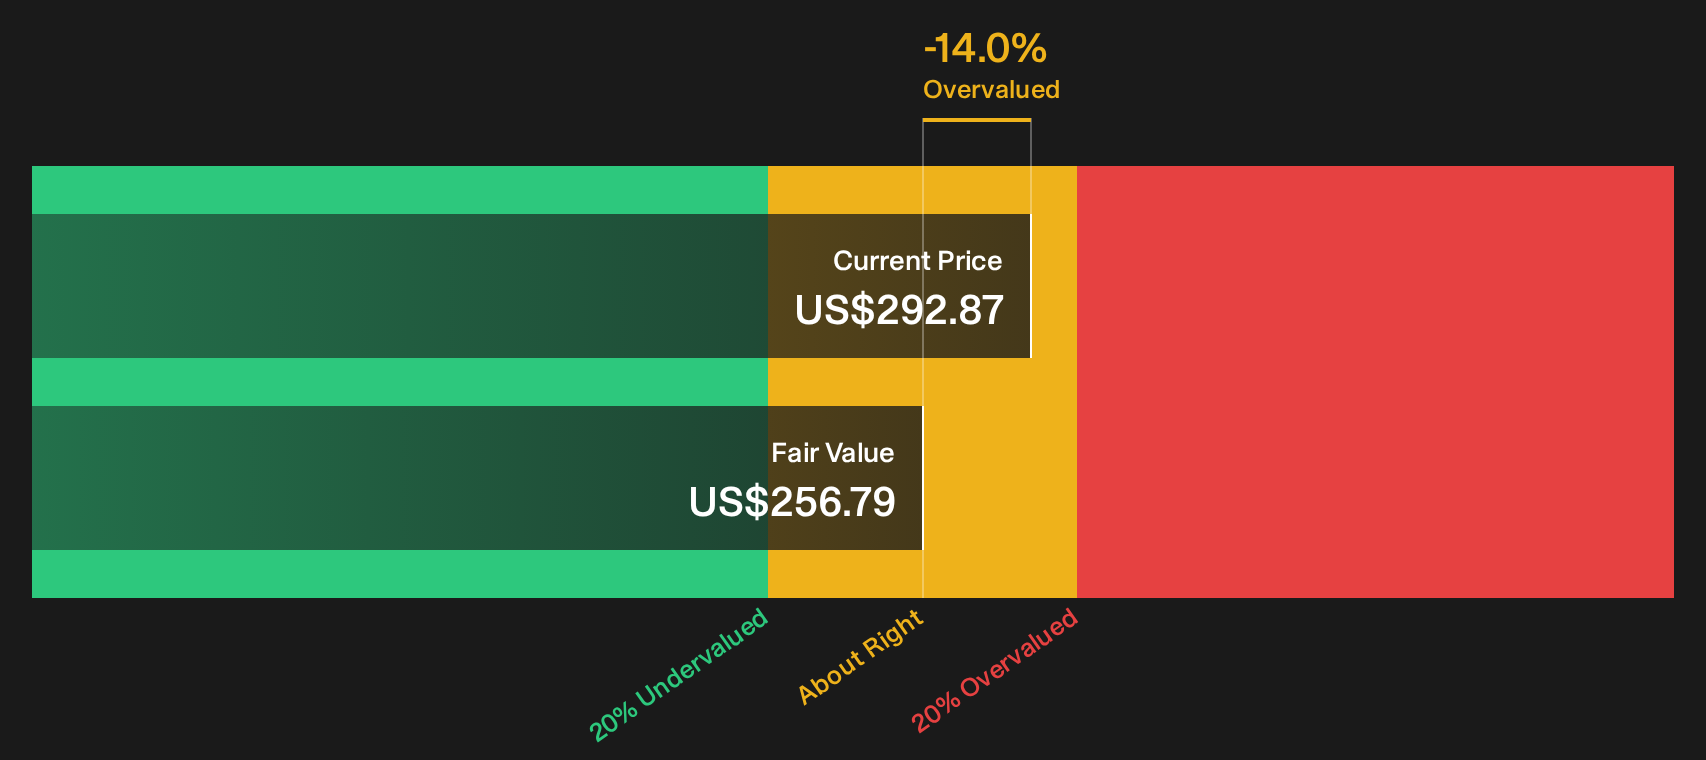
The Discounted Cash Flow (DCF) model for Union Pacific takes its projected future cash flows and brings them back to today’s dollars. On this model, the latest twelve month free cash flow sits at about US$5.8b, with analysts expecting it to grow over time rather than shrink. Feeding those cash flows into a two stage DCF produces an intrinsic value estimate of about $286 per share.
Against the current share price around $299, that implies Union Pacific stock is trading roughly 4.8% above the DCF estimate, so the shares look slightly overvalued rather than obviously cheap on this method alone. Because the proposed US$85b merger with Norfolk Southern is framed around revenue and cost synergies that could lift free cash flow, it helps explain why the market is willing to pay a small premium to the current intrinsic value estimate.
Overall, Union Pacific comes across as about fairly valued on the DCF model, with only a modest premium to its estimated intrinsic value.
Union Pacific is fairly valued according to our Discounted Cash Flow (DCF), but this can change at a moment's notice. Track the value in your watchlist or portfolio and be alerted on when to act.
Does Union Pacific Look Undervalued on Earnings?
P/E is usually a sensible way to look at Union Pacific because earnings are a primary focus for rail operators. At around 24.6x, Union Pacific’s current P/E sits below both the Transportation industry average of about 40.8x and a peer group average of roughly 31.5x, which indicates the stock is not priced at a premium to the sector or direct rivals.
A more tailored fair P/E multiple for Union Pacific, which takes into account its profile, comes out at about 27.7x. This is several turns higher than the current 24.6x and suggests the stock trades at a discount relative to this framework. While headline news around the proposed Norfolk Southern merger has supported interest in Union Pacific stock, the P/E remains below both the modelled fair ratio and peers.
On balance, Union Pacific appears undervalued on its current P/E multiple.

See what the numbers say about this price — find out in our valuation breakdown.
The Union Pacific Narrative: What Would Justify Today's Price?
Simply Wall St Narratives for Union Pacific pick up where the valuation debate leaves off by spelling out which combinations of future growth, margins and earnings would need to play out for the stock to be worth materially more or less than today’s price. Each Narrative sets out Union Pacific’s fair value as a thesis about the business that can be revisited over time, rather than a one off snapshot, and lives on the company’s Community page.
Be one of the first voices in the Simply Wall St community to set out a number driven narrative on Union Pacific, including a clear view on whether the proposed US$85b merger with Norfolk Southern and the planned revenue and cost synergies ultimately justify today's price.
Spell out your assumptions, publish your thesis and track how it holds up as new merger updates, operating data and financial results come through.
Do you think there's more to the story for Union Pacific? Head over to our Community to see what others are saying!
The Bottom Line
For Union Pacific, the Discounted Cash Flow (DCF) intrinsic value estimate sits slightly below the current share price, while the P/E view points to the stock trading at a modest discount to its tailored fair multiple and to peers. Taken together with the mixed overall valuation checks, the picture is closer to reasonably priced than to a clear bargain. What matters most from here is whether Union Pacific can deliver the cash flow and earnings that justify both the merger expectations and any P/E re rating, rather than leaving the current discount as a value trap.
This article by Simply Wall St is general in nature. We provide commentary based on historical data and analyst forecasts only using an unbiased methodology and our articles are not intended to be financial advice. It does not constitute a recommendation to buy or sell any stock, and does not take account of your objectives, or your financial situation. We aim to bring you long-term focused analysis driven by fundamental data. Note that our analysis may not factor in the latest price-sensitive company announcements or qualitative material. Simply Wall St has no position in any stocks mentioned.
Have feedback on this article? Concerned about the content? Get in touch with us directly. Alternatively, email editorial-team@simplywallst.com