
Peab (OM:PEAB B) Posted Stronger Results And New Contracts, Is It Still Below Fair Value?
Peab (OM:PEAB B) stock is in focus after the company reported second quarter 2026 earnings, with sales of SEK 16,558 million and net income of SEK 588 million, along with several newly awarded contracts.
See our latest analysis for Peab.
Following the earnings release and recent contract wins in Sweden, Peab's 1 day share price return of 4.18% stands against a 90 day share price decline of 8.6%, while its 3 year total shareholder return of 120.56% points to stronger long run compounding.
If Peab's latest moves have you thinking about where else capital projects and infrastructure spending could create opportunities, take a look at 34 power grid technology and infrastructure stocks.
Bulls see Peab’s stronger recent results and fresh contracts as support for a higher price, while bears point to the weaker 90 day share performance. Which side does the current valuation evidence lean toward next?
Price-to-Earnings of 16.4x: Is it justified?
On the latest figures, Peab trades on a P/E of 16.4x, which sits below several fair value markers but slightly above the broader European construction peer group.
The P/E ratio compares Peab's current share price to its earnings per share and is a common way investors assess how much they are paying for each unit of profit. For a construction and civil engineering company with SEK 58,588 million in revenue and SEK 1,558 million in net income, this yardstick helps frame how the market is weighing current profitability against expectations.
According to Simply Wall St's analysis, Peab's P/E of 16.4x is below an estimated "fair" P/E of 24.4x and below a peer average of 62.3x. This signals the market is pricing its earnings at a discount to both those reference points. At the same time, the ratio is described as expensive versus the wider European construction industry average of 15.3x. This indicates investors are paying a modest premium relative to the broader sector even though internal metrics such as a 2.7% net margin and 9.5% return on equity are flagged as low in the checks.
This split picture, cheaper than some fair value and peer benchmarks but slightly richer than the industry average, highlights how sensitive Peab's valuation could be to shifts in earnings quality, debt levels and future profit growth.
Explore the SWS fair ratio for Peab.
Result: Price-to-Earnings of 16.4x (UNDERVALUED)
However, Peab's recent 90 day share price decline and relatively low net margin leave the story exposed if contract momentum or construction demand softens.
Find out about the key risks to this Peab narrative.
Another view on Peab using DCF
While the P/E comparison paints Peab as relatively cheap versus its fair ratio and peers, Simply Wall St's DCF model goes further by estimating the value of future cash flows. On that basis, the stock at SEK90.9 is assessed as trading around 30% below an estimated value of SEK129.96, which also points to an undervalued picture. If both earnings multiples and cash flow estimates point in the same direction, the question becomes which risks could close or widen that gap.
Look into how the SWS DCF model arrives at its fair value.
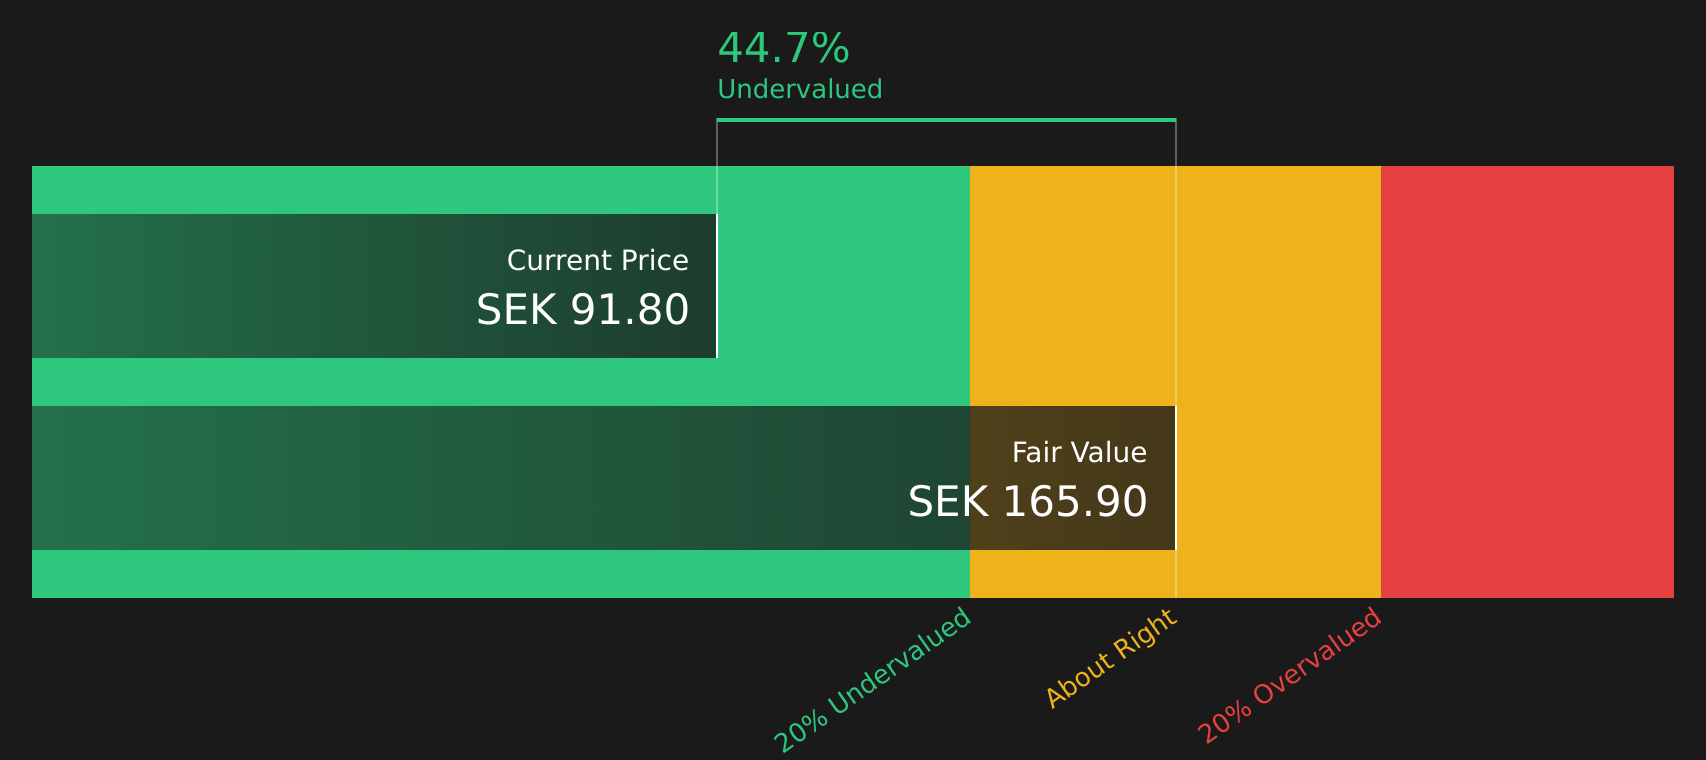
Simply Wall St performs a discounted cash flow (DCF) on every stock in the world every day (check out Peab for example). We show the entire calculation in full. You can track the result in your watchlist or portfolio and be alerted when this changes, or use our stock screener to discover 215 high quality undervalued stocks. If you save a screener we even alert you when new companies match - so you never miss a potential opportunity.
Next Steps
If this Peab story seems finely balanced between risk and reward, consider reviewing the full data promptly and deciding where you stand, starting with the 2 key rewards and 3 important warning signs.
Looking for more investment ideas beyond Peab?
If Peab has sharpened your focus on construction and infrastructure, do not stop there. Use the Simply Wall St screener to quickly spot other targeted opportunities.
- Target resilient income potential by reviewing companies described as 474 dividend fortresses that could complement Peab in a long term portfolio.
- Zero in on value opportunities by checking out the screener containing 504 high quality undiscovered gems before others spot them and reassess the market.
- Strengthen your downside protection by scanning the 292 resilient stocks with low risk scores so you are not relying on Peab alone for stability.
This article by Simply Wall St is general in nature. We provide commentary based on historical data and analyst forecasts only using an unbiased methodology and our articles are not intended to be financial advice. It does not constitute a recommendation to buy or sell any stock, and does not take account of your objectives, or your financial situation. We aim to bring you long-term focused analysis driven by fundamental data. Note that our analysis may not factor in the latest price-sensitive company announcements or qualitative material. Simply Wall St has no position in any stocks mentioned.
Have feedback on this article? Concerned about the content? Get in touch with us directly. Alternatively, email editorial-team@simplywallst.com