
Nike (NKE) Stock May Be Cheap On Earnings But Fair On Cash Flow
NIKE stock has had a tough run over the last five years, yet its current valuation signals are less one sided, with the Discounted Cash Flow (DCF) intrinsic value estimate sitting close to the market price while earnings based multiples suggest the shares may be on the cheaper side.
- The share price has fallen about 69.8% over five years, which puts NIKE firmly in turnaround territory for anyone looking at long term returns.
- Recent restructuring efforts and a leadership change can support expectations for leaner operations over time, while pressure on key regions and ongoing brand and legal challenges may weigh on how much investors are willing to pay for future cash flows.
- On Simply Wall St's broader checks, NIKE scores 4 out of 6, which is a mixed picture rather than a clear bargain or clear overvaluation.
The issue now is whether NIKE's current price around its intrinsic value estimate still offers enough upside potential to justify the risks that come with a stock in the middle of a long running reset.
Find out why NIKE's -37.2% return over the last year is lagging behind its peers.
Does NIKE Look Fairly Valued on Cash Flow?
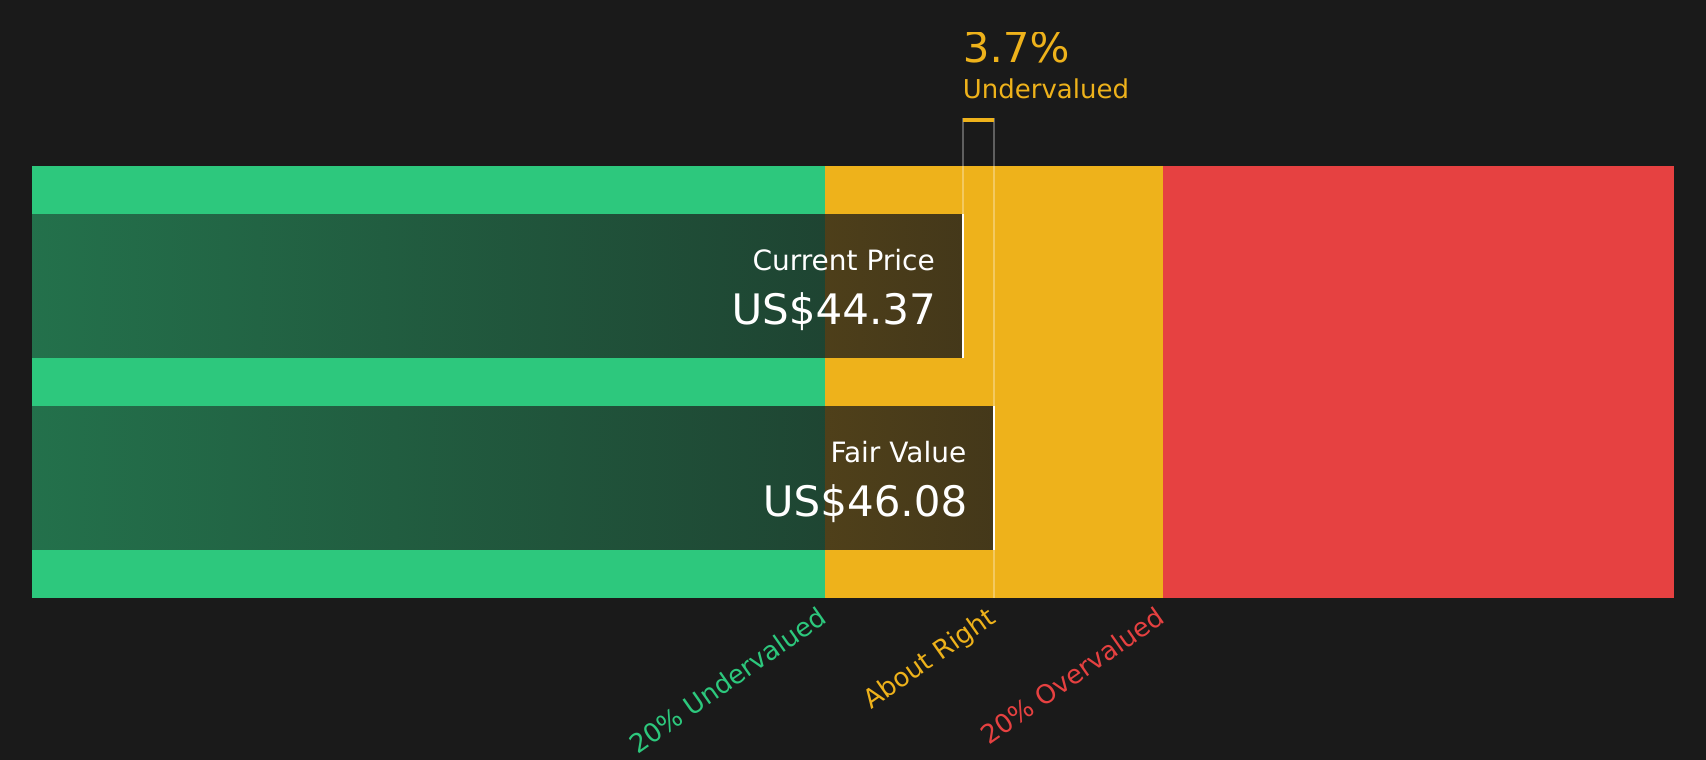
The Discounted Cash Flow (DCF) model here projects what NIKE’s future free cash flows could be worth in today’s dollars. Based on the latest twelve-month free cash flow of about $1.0b and an assumption that those cash flows recover over time rather than shrink, the model arrives at an intrinsic value of roughly $46.08 per share.
With NIKE’s current share price sitting only about 3.7% below that estimate, the stock appears only mildly undervalued rather than a clear bargain. Nike’s ongoing restructuring, cautious sales guidance, and pressure in Greater China help explain why the market may be reluctant to assign a larger premium to those projected cash flows, even after recent earnings beats and margin improvements.
Overall, the DCF analysis indicates that NIKE is roughly fairly valued today, with only a small undervaluation relative to its estimated intrinsic worth.
NIKE is fairly valued according to our Discounted Cash Flow (DCF), but this can change at a moment's notice. Track the value in your watchlist or portfolio and be alerted on when to act.
Is NIKE a Bargain on Earnings?
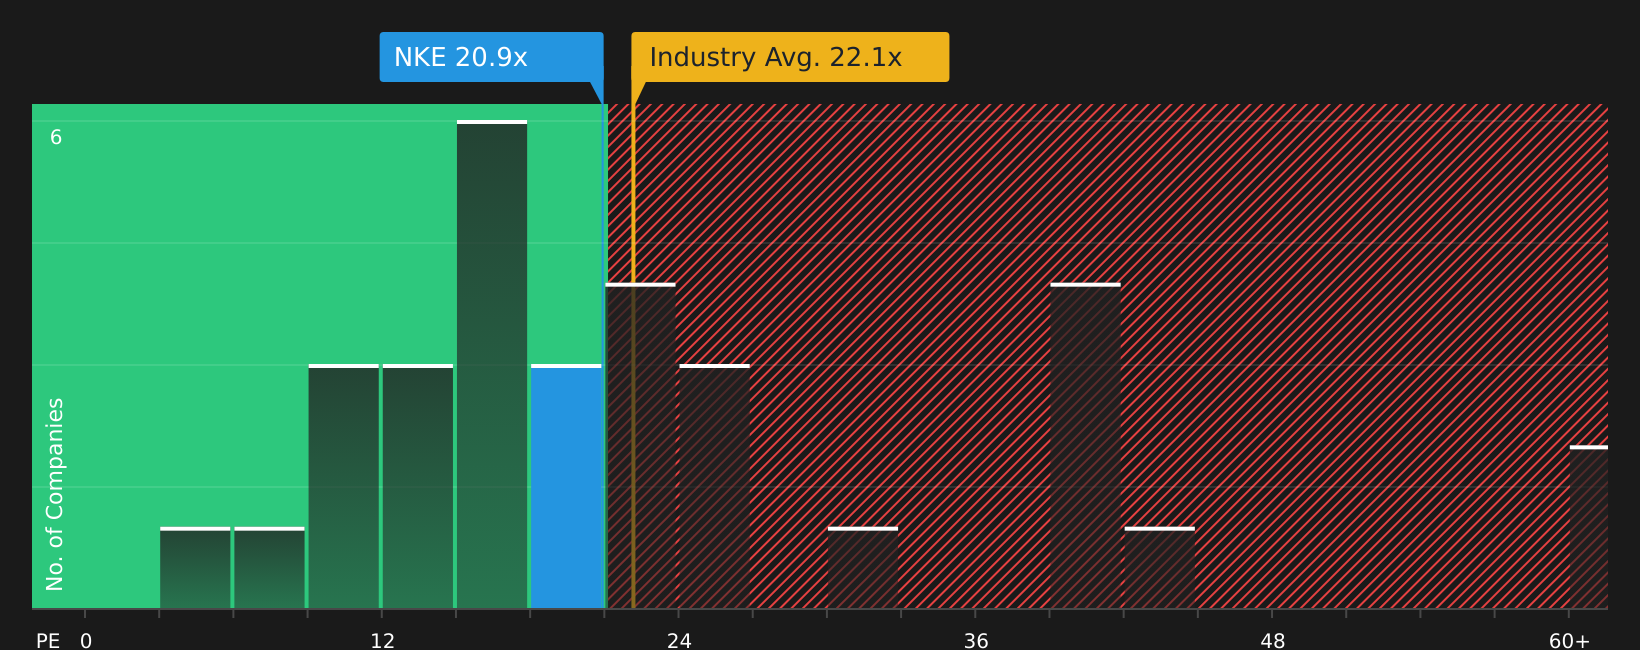
The P/E ratio suits NIKE because earnings are still a key yardstick for a mature, profitable consumer brand. NIKE’s current P/E of about 21.1x sits below the Luxury industry average of 22.1x and well under the peer group average of 29.1x, so the stock is not priced at a premium to its sector or closest rivals.
On Simply Wall St’s more tailored fair P/E of 26.6x, which factors in the company’s scale, margins and risk profile, NIKE trades at a clear discount, with the current multiple several turns lower than that fair ratio. That gap suggests the market is treating the recent reset, execution issues and regional pressure as more significant than the model implies.
On the P/E multiple alone, NIKE stock currently appears undervalued compared with both its fair ratio and peer benchmarks.
See what the numbers say about this price — find out in our valuation breakdown.
The NIKE Narrative: What Would Justify Today's Price?
Simply Wall St Narratives pick up where NIKE's valuation puzzle leaves off by spelling out which paths for NIKE's growth, margins and earnings would need to hold for the stock to be worth materially more or less than today’s price, and they sit on the company’s Community page. Each one sets out a fair value as a thesis about NIKE's business that you can watch over time, rather than a static point estimate.
Community views on NIKE are sharply split, with one camp seeing a reset opportunity and another arguing the stock still prices in too much optimism.
Bull case: 27% undervalued
"Nike is accelerating the transition of its product portfolio, aiming for sport performance dimensions to drive growth…"
Read the full Bull Case to see why NIKE could be undervalued
Bear case: 20% overvalued
"As you can see from the above Nike seems to be overvalued given that its current price of 40 dollars is well above P90…"
Read the full Bear Case to see why NIKE could be overvalued
Do you think there's more to the story for NIKE? Head over to our Community to see what others are saying!
The Bottom Line
For NIKE, the Discounted Cash Flow (DCF) work suggests the stock is trading close to its intrinsic value, with only a modest discount that does not on its own indicate clear mispricing. The P/E perspective points more clearly toward undervaluation, suggesting that sentiment and reset fatigue may be holding the multiple back. With broader checks sitting in mixed territory, the key question for investors is whether NIKE can turn its restructuring and leadership changes into steady earnings power that eventually supports a higher multiple, or whether the current discount reflects ongoing execution and brand risks that persist.
This article by Simply Wall St is general in nature. We provide commentary based on historical data and analyst forecasts only using an unbiased methodology and our articles are not intended to be financial advice. It does not constitute a recommendation to buy or sell any stock, and does not take account of your objectives, or your financial situation. We aim to bring you long-term focused analysis driven by fundamental data. Note that our analysis may not factor in the latest price-sensitive company announcements or qualitative material. Simply Wall St has no position in any stocks mentioned.
Have feedback on this article? Concerned about the content? Get in touch with us directly. Alternatively, email editorial-team@simplywallst.com