
- PREMIUM
- LIVE QUOTES
- INSTITUTIONS
 Index Options
 State Street
 CME Group
 Nasdaq
 Cboe
Cboe TradingView
 Wall Street Journal
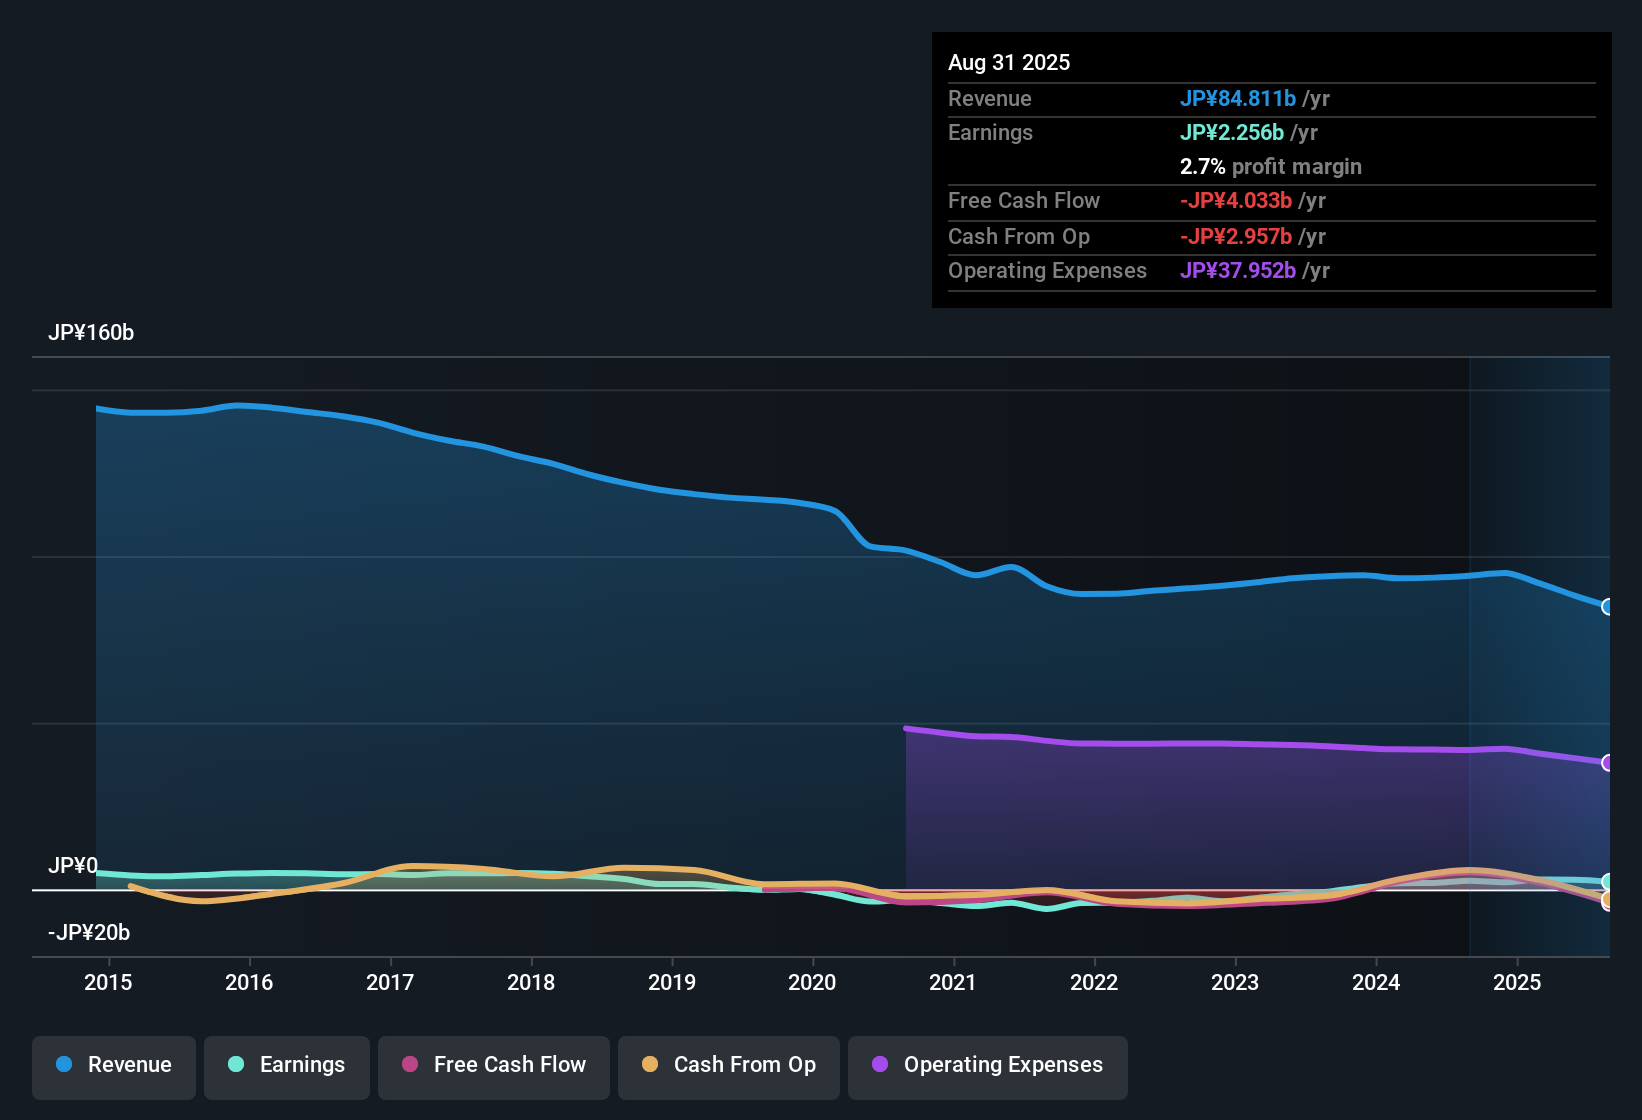
Chiyoda (TSE:8185) Margin Improvement To 2.8% Tests Cautious Earnings Narratives
Chiyoda (TSE:8185) has put up a mixed Q3 2026 scorecard, with revenue of ¥20.3b and basic EPS of ¥20.72, set against trailing 12 month EPS of ¥66.41 and a net profit margin of 2.8% compared with 2.2% a year earlier. Over recent quarters the company has seen revenue move from ¥23.8b in Q3 2025 to ¥19.2b in Q4 2025, ¥22.0b in Q1 2026, ¥19.9b in Q2 2026 and now ¥20.3b in Q3 2026, while quarterly EPS has ranged from ¥7.22 to ¥37.15 through that stretch. For investors, this mix of current earnings trends, relatively modest revenue changes and gradually firmer margins sets the stage for a results season that is more about profitability resilience than headline expansion.
See our full analysis for Chiyoda.With the latest figures on the table, the next step is to line these results up against the prevailing narratives around Chiyoda to see which stories the numbers support and which they start to challenge.
Curious how numbers become stories that shape markets? Explore Community Narratives
TTM EPS of ¥66.41 with choppy quarterly pattern
- Over the last 12 months, basic EPS totals ¥66.41, but within that you have a wide quarterly range, from a loss per share of ¥11.16 in Q2 2026 to a high of ¥37.15 in Q1 2026, with Q3 2026 landing at ¥20.72.
- What stands out for a more cautious bearish view is that this 8% year over year EPS increase to ¥66.41 sits on uneven quarterly earnings, which
- includes a Q2 2026 net loss of ¥385 million despite full year net income of ¥2,305 million for the last 12 months, and
- relies on only modest forecast earnings growth of about 2.2% per year, so the recent upswing in trailing EPS is not matched by strong growth expectations.
Net margin at 2.8% on ¥81.3b TTM revenue
- On a trailing basis, Chiyoda generated ¥81.3b of revenue with net income of ¥2,305 million, which translates into a 2.8% net profit margin compared with 2.2% a year earlier.
- Supporters taking a more bullish stance point to this margin improvement as evidence of better profitability, yet
- forecasts still only point to roughly 1.5% annual revenue growth, which keeps overall growth expectations fairly low, and
- the modest 2.8% margin leaves limited room for error if costs rise or revenue slips from the recent quarterly range of ¥19.2b to ¥23.8b.
P/E of 16.5x with 4.83% dividend and weak cash cover
- The shares trade at ¥1,119 with a P/E of 16.5x, slightly below peers at 17.1x but above the JP Specialty Retail average of 14.5x, while the dividend yield sits at 4.83% and is flagged as not well covered by free cash flow.
- Critics with a bearish tilt see this mix as a warning sign, because
- the share price stands above the DCF fair value of ¥766.47 even though earnings are only expected to grow about 2.2% per year, and
- the 4.83% dividend looks appealing on the surface, yet weak free cash flow coverage means that payout depends heavily on earnings and cash generation staying on track.
Next Steps
Don't just look at this quarter; the real story is in the long-term trend. We've done an in-depth analysis on Chiyoda's growth and its valuation to see if today's price is a bargain. Add the company to your watchlist or portfolio now so you don't miss the next big move.
See What Else Is Out There
Chiyoda’s choppy earnings pattern, modest growth expectations and relatively thin 2.8% net margin highlight how reliant the story is on every quarter going right.
If you want ideas with pricing that looks more conservative, use our these 878 undervalued stocks based on cash flows to quickly zero in on companies where cash flow points to potentially better value.
This article by Simply Wall St is general in nature. We provide commentary based on historical data and analyst forecasts only using an unbiased methodology and our articles are not intended to be financial advice. It does not constitute a recommendation to buy or sell any stock, and does not take account of your objectives, or your financial situation. We aim to bring you long-term focused analysis driven by fundamental data. Note that our analysis may not factor in the latest price-sensitive company announcements or qualitative material. Simply Wall St has no position in any stocks mentioned.
Have feedback on this article? Concerned about the content? Get in touch with us directly. Alternatively, email editorial-team@simplywallst.com