
- PREMIUM
- LIVE QUOTES
- INSTITUTIONS
 Index Options
 State Street
 CME Group
 Nasdaq
 Cboe
Cboe TradingView
 Wall Street Journal
Is It Time To Reassess Equinix (EQIX) After Its Recent Share Price Recovery?
- For investors wondering whether Equinix, at around US$800 per share, is priced fairly or trading at a premium, this article examines what the current market price may indicate about the stock's value.
- The share price has recently closed at US$800.35, with returns of 4.7% over the past week, 9.0% over the last 30 days, 4.7% year to date, 18.0% over 3 years and 24.5% over 5 years. The 1-year return stands at a 9.0% decline.
- Recent attention on Equinix has largely focused on its role as a key data center and interconnection player. Investors are watching how its global footprint and digital infrastructure services align with demand for cloud and connectivity. Coverage has also highlighted how real estate investment trusts in the data center space are being compared on valuation and balance sheet strength, which helps frame how the market is currently treating Equinix shares.
- Right now, Equinix has a valuation score of 2 out of 6. This means it screens as undervalued on 2 of our 6 checks. We will look at what different valuation methods indicate about that score before finishing with a more complete way to think about the stock's value beyond the headline metrics.
Equinix scores just 2/6 on our valuation checks. See what other red flags we found in the full valuation breakdown.
Approach 1: Equinix Discounted Cash Flow (DCF) Analysis
A DCF model takes a company’s projected cash flows, in this case adjusted funds from operations, and discounts them back to today using a required rate of return. The goal is to estimate what those future dollars are worth in the present.
For Equinix, the latest twelve month free cash flow is reported at about US$3.356b. Based on analyst inputs for the next few years, and then extrapolations by Simply Wall St, those cash flows are projected to reach about US$5.967b by 2030. A detailed 2 Stage Free Cash Flow to Equity model using these figures produces an estimated intrinsic value of US$1,299.32 per share.
Compared with the recent share price of about US$800, this DCF output implies an intrinsic discount of 38.4%. On this model, the shares screen as undervalued. As always, the result depends on the accuracy of the cash flow forecasts and discount rate assumptions, but it does indicate that the current market price is well below the modeled value.
Result: UNDERVALUED
Our Discounted Cash Flow (DCF) analysis suggests Equinix is undervalued by 38.4%. Track this in your watchlist or portfolio, or discover 877 more undervalued stocks based on cash flows.

Approach 2: Equinix Price vs Earnings
For a profitable company like Equinix, the P/E ratio is a useful way to see what investors are currently willing to pay for each dollar of earnings. It ties the share price directly to the business’s bottom line, which makes it a common starting point when you are comparing listed stocks.
What counts as a “normal” P/E depends on how quickly earnings are expected to grow and how risky those earnings appear. Higher expected growth or lower perceived risk can justify a higher multiple, while slower growth or higher risk usually point to a lower one.
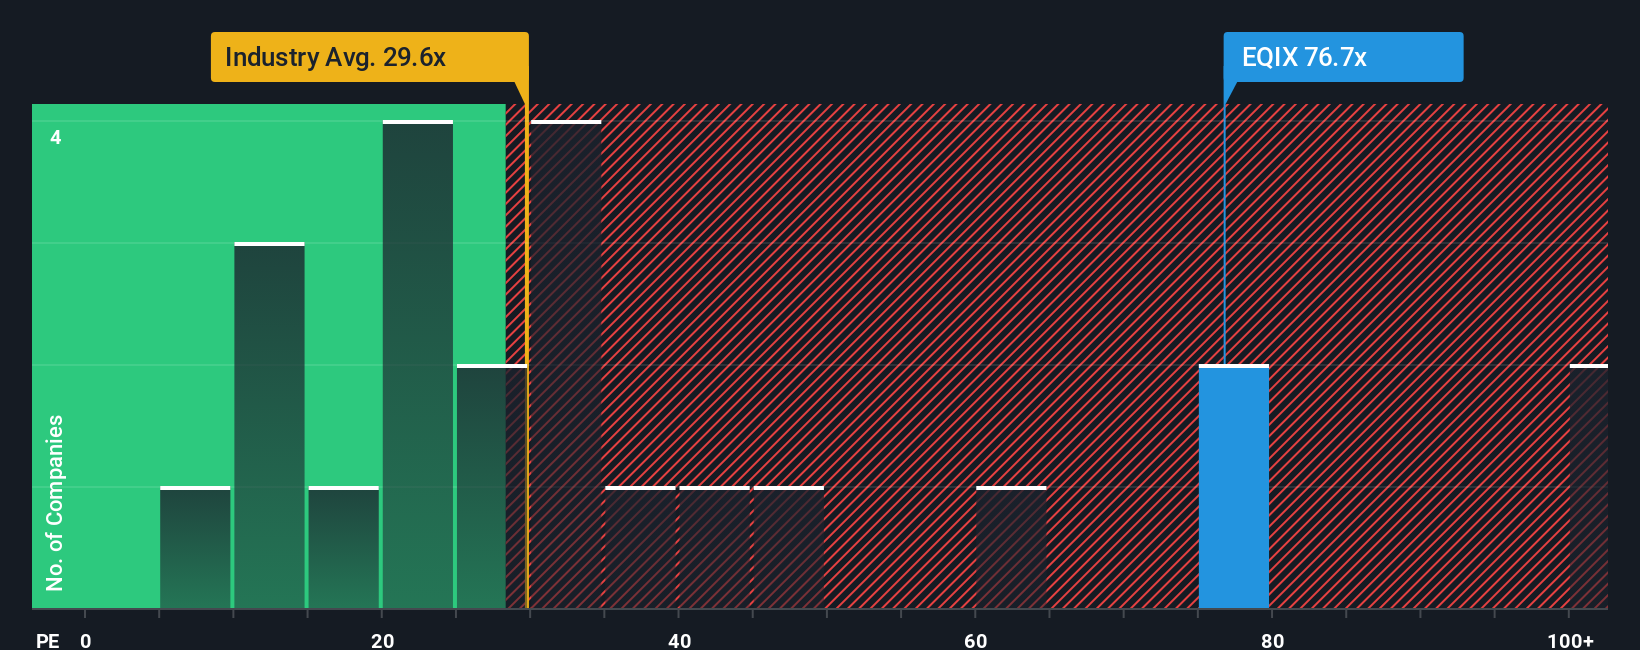
Equinix currently trades on a P/E of 73.37x. That sits well above the Specialized REITs industry average of 16.61x and the peer average of 30.63x. Simply Wall St’s Fair Ratio for Equinix is 35.91x. This is its estimate of an appropriate P/E once factors like earnings growth, industry, profit margins, market cap and risk are taken into account. This Fair Ratio can be more informative than simple peer or sector comparisons because it adjusts for those business specific drivers instead of treating all companies as identical. Compared with the current 73.37x P/E, the 35.91x Fair Ratio suggests the shares look overvalued on this metric.
Result: OVERVALUED
P/E ratios tell one story, but what if the real opportunity lies elsewhere? Discover 1442 companies where insiders are betting big on explosive growth.
Upgrade Your Decision Making: Choose your Equinix Narrative
Earlier we mentioned that there is an even better way to understand valuation, so let us introduce you to Narratives, a simple tool on Simply Wall St’s Community page where you connect your view of Equinix’s story to a set of forecast numbers and a Fair Value. You can then compare that Fair Value to the current share price to decide whether you see the stock as attractively priced or not. Each Narrative updates automatically when new news or earnings arrive, so different investors can legitimately land in different places. For example, one Equinix Narrative could lean on the higher US$1,200 analyst price target and stronger revenue and margin expectations, while another might anchor closer to the US$804 low target with more cautious assumptions. Both Narratives sit side by side on the platform so you can choose the story and numbers that fit your own view.
Do you think there's more to the story for Equinix? Head over to our Community to see what others are saying!

This article by Simply Wall St is general in nature. We provide commentary based on historical data and analyst forecasts only using an unbiased methodology and our articles are not intended to be financial advice. It does not constitute a recommendation to buy or sell any stock, and does not take account of your objectives, or your financial situation. We aim to bring you long-term focused analysis driven by fundamental data. Note that our analysis may not factor in the latest price-sensitive company announcements or qualitative material. Simply Wall St has no position in any stocks mentioned.
Have feedback on this article? Concerned about the content? Get in touch with us directly. Alternatively, email editorial-team@simplywallst.com