
- PREMIUM
- LIVE QUOTES
- INSTITUTIONS
 Index Options
 State Street
 CME Group
 Nasdaq
 Cboe
Cboe TradingView
 Wall Street Journal
Is Tilray Brands (TLRY) Pricing In A Rebound After Recent Share Price Weakness
- Wondering whether Tilray Brands at around US$9.13 is priced for a rebound or more pain? This article walks you through what that price might actually imply about value.
- The stock has recently shown mixed momentum, with a 1.1% return over the last 7 days and 12.9% over the last 30 days, while still sitting on a 6.1% decline year to date and a 33.4% decline over the past year.
- Recent coverage around Tilray Brands has focused on its position in the cannabis and consumer packaged goods space, as investors weigh how the company fits into a sector that has seen shifting sentiment and regulatory discussion. At the same time, the long term 72.2% return over three years highlights how past enthusiasm and current pricing can diverge sharply. This is important context for any valuation work.
- On Simply Wall St’s checks, Tilray Brands scores 4 out of 6 on valuation. This suggests some areas where the stock screens as potentially cheaper than certain benchmarks and others where it does not. Next we will look at how different valuation approaches arrive at that score before turning to an even sharper way to think about what the shares could be worth.
Find out why Tilray Brands's -33.4% return over the last year is lagging behind its peers.
Approach 1: Tilray Brands Discounted Cash Flow (DCF) Analysis
A Discounted Cash Flow model takes projected future cash flows and discounts them back to today to estimate what the business could be worth now.
For Tilray Brands, the latest twelve month free cash flow is a loss of about $93.4 million, so the model leans heavily on future improvement. Analyst and extrapolated estimates used here project free cash flow rising to $43 million by 2030, with a series of yearly estimates between 2026 and 2035 that Simply Wall St extends beyond the analyst window.
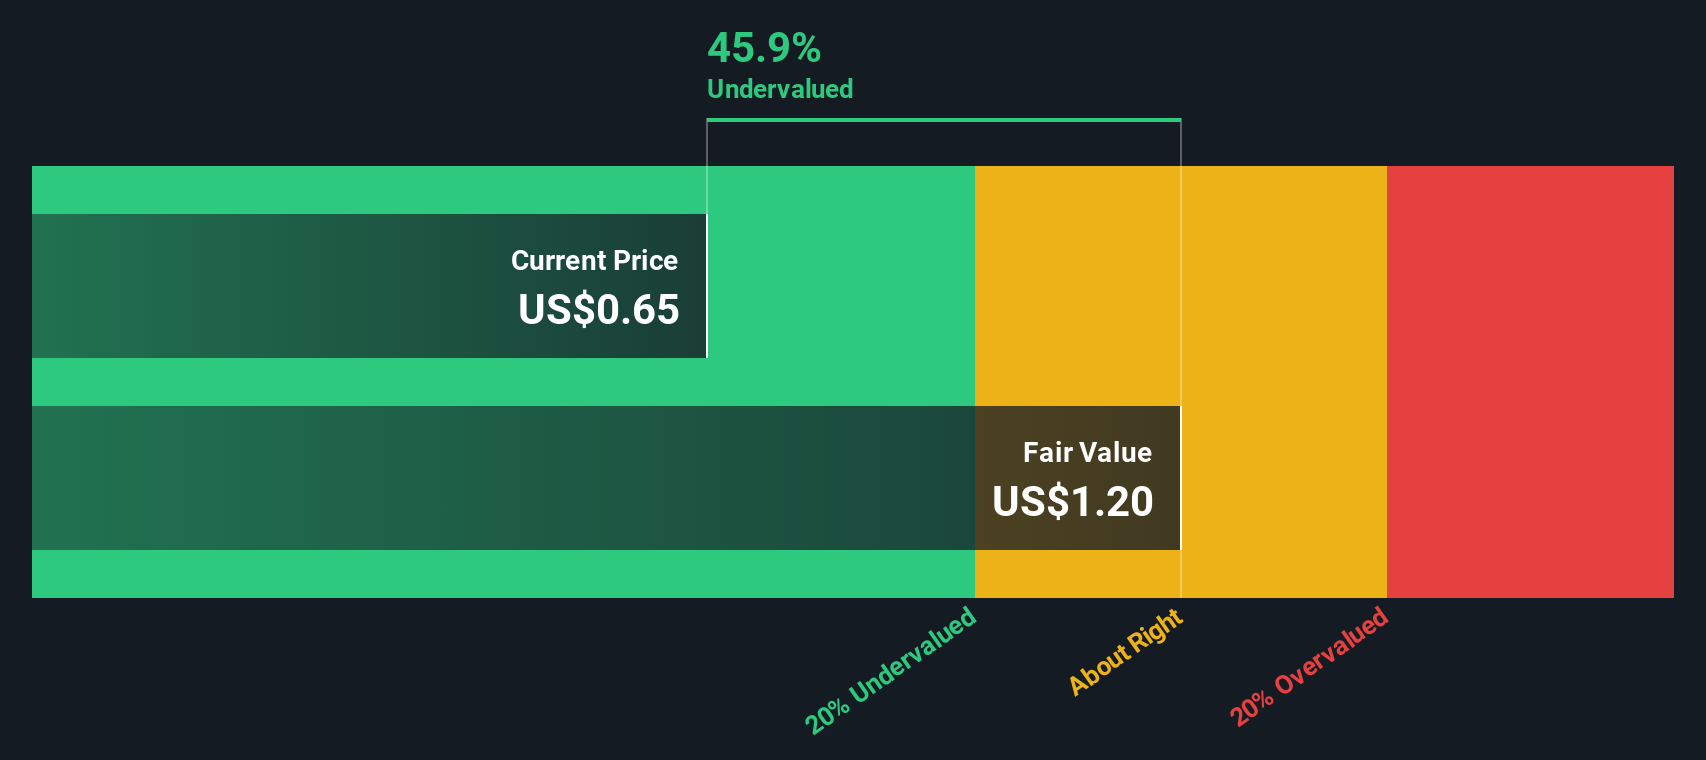
When these projected cash flows are discounted using a 2 Stage Free Cash Flow to Equity model, the resulting intrinsic value is about US$10.97 per share. Compared with the recent share price around US$9.13, the model implies the stock trades at a 16.7% discount, which indicates potential undervaluation on this set of assumptions.
Result: UNDERVALUED
Our Discounted Cash Flow (DCF) analysis suggests Tilray Brands is undervalued by 16.7%. Track this in your watchlist or portfolio, or discover 881 more undervalued stocks based on cash flows.
Approach 2: Tilray Brands Price vs Sales
P/S is a useful yardstick for companies where earnings are limited or volatile, because it anchors valuation to revenue, which tends to be more stable than profit. Investors usually pay a higher or lower P/S depending on what they expect for future growth and how much risk they see in the business, so there is no single “right” multiple that fits every stock.
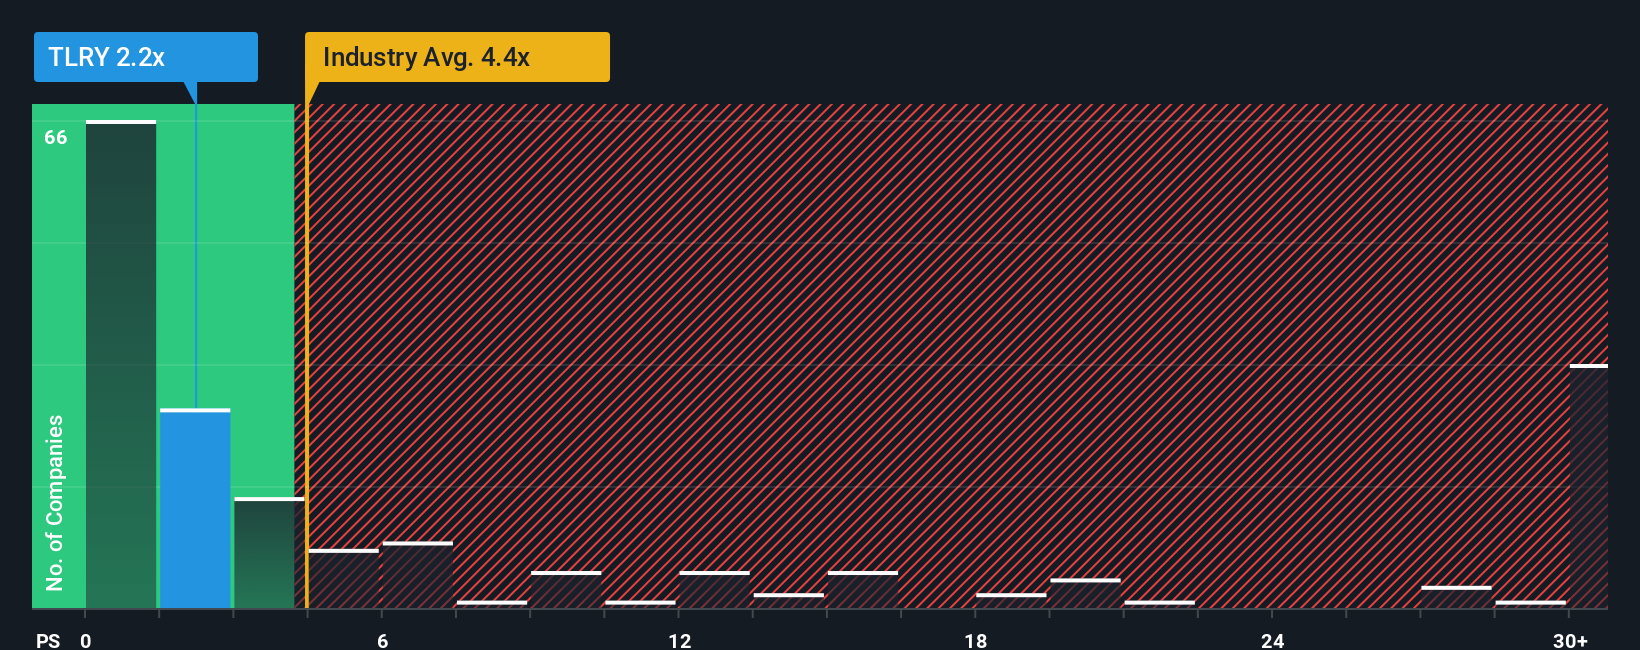
Tilray Brands currently trades on a P/S of 1.27x. That sits well below the Pharmaceuticals industry average P/S of 4.31x and the peer group average of about 4.09x. On the surface, that points to a lower valuation relative to many comparable names.
Simply Wall St’s Fair Ratio for Tilray Brands is 1.72x P/S. This proprietary estimate looks at factors such as earnings growth, profit margins, industry, market cap and risk to suggest a company specific multiple, which can often be more tailored than a simple comparison with peers or the broad industry.
Comparing the Fair Ratio of 1.72x with the current 1.27x P/S suggests Tilray Brands trades below where this framework would place it, which points to potential undervaluation on these inputs.
Result: UNDERVALUED
P/S ratios tell one story, but what if the real opportunity lies elsewhere? Discover 1445 companies where insiders are betting big on explosive growth.
Upgrade Your Decision Making: Choose your Tilray Brands Narrative
Earlier we mentioned that there is an even better way to understand valuation. On Simply Wall St you can use Narratives on the Tilray Brands Community page to link your story about the company to specific forecasts for future revenue, earnings and margins. You can then convert those into your own fair value, compare that fair value with the current price to help decide whether to buy or sell, and see that view update automatically as new earnings or news arrive. This is why one investor might build a Narrative that supports a fair value near US$16.17, while another might lean closer to the lower analyst target around US$0.60 based on a more cautious story.
Do you think there's more to the story for Tilray Brands? Head over to our Community to see what others are saying!

This article by Simply Wall St is general in nature. We provide commentary based on historical data and analyst forecasts only using an unbiased methodology and our articles are not intended to be financial advice. It does not constitute a recommendation to buy or sell any stock, and does not take account of your objectives, or your financial situation. We aim to bring you long-term focused analysis driven by fundamental data. Note that our analysis may not factor in the latest price-sensitive company announcements or qualitative material. Simply Wall St has no position in any stocks mentioned.
Have feedback on this article? Concerned about the content? Get in touch with us directly. Alternatively, email editorial-team@simplywallst.com