
- PREMIUM
- LIVE QUOTES
- INSTITUTIONS
 Index Options
 State Street
 CME Group
 Nasdaq
 Cboe
Cboe TradingView
 Wall Street Journal
A Look At Buckle (BKE) Valuation After Recent Comparable Store Sales Growth
Why Buckle stock is back in focus
Buckle (BKE) is on investors’ radar after reporting a 5.5% rise in comparable store net sales and 6.5% growth in total net sales for the 5 week period ending January 3, 2026.
See our latest analysis for Buckle.
The latest sales update comes as Buckle’s share price sits at US$55.61, with a 1 day share price return of 3.19% and a 90 day share price return of 5.46%, while the 1 year total shareholder return of 19.90% and 5 year total shareholder return of 163.01% point to momentum that has built over time rather than faded.
If Buckle’s sales update has you thinking more broadly about retail, it could be a good moment to broaden your watchlist with fast growing stocks with high insider ownership.
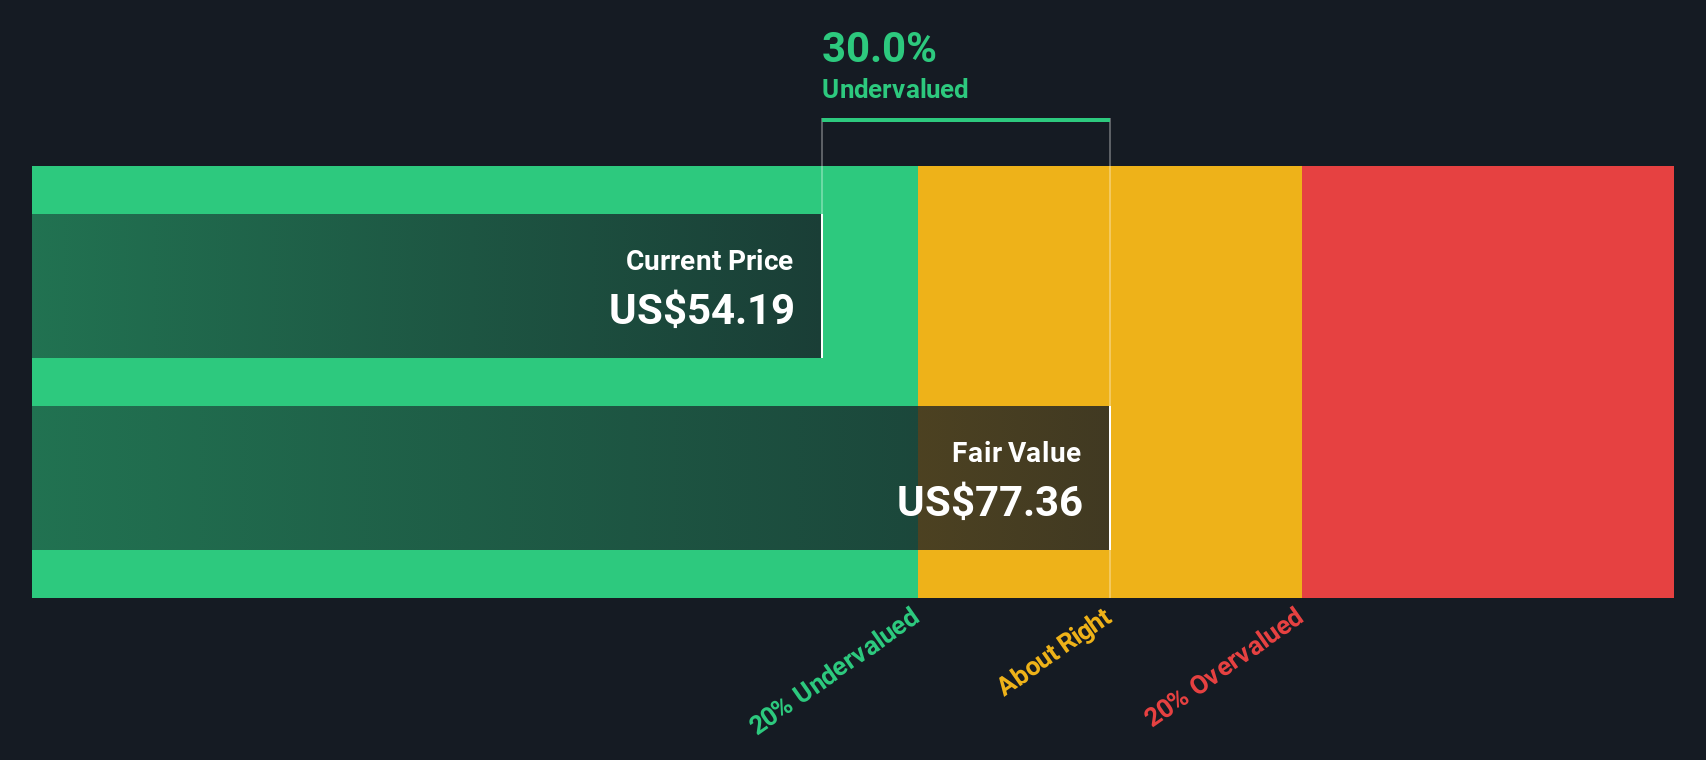
With Buckle trading around US$55.61 and an intrinsic value estimate implying a roughly 29% discount, the key question now is simple: is this a genuine mispricing, or is the market already baking in future growth?
Most Popular Narrative Narrative: 3% Overvalued
Compared with Buckle’s last close at US$55.61, the most widely followed narrative points to a fair value a little lower, based on detailed cash flow assumptions.
The analysts have a consensus price target of $54.0 for Buckle based on their expectations of its future earnings growth, profit margins and other risk factors.
In order for you to agree with the analyst's consensus, you'd need to believe that by 2028, revenues will be $1.4 billion, earnings will come to $226.1 million, and it would be trading on a PE ratio of 15.5x, assuming you use a discount rate of 8.4%.
Curious what sits behind that earnings target and future P/E multiple? The narrative leans on steady growth, firm margins and a specific discount rate assumption.
Result: Fair Value of $54 (OVERVALUED)
Have a read of the narrative in full and understand what's behind the forecasts.
However, a heavy tilt toward mall locations, combined with relatively modest e-commerce sales, could pressure margins if shopper traffic or digital adoption move against expectations.
Find out about the key risks to this Buckle narrative.
Another Angle on Buckle's Value
Our SWS DCF model arrives at an estimated fair value of US$79.14 per share for Buckle, compared with the recent price around US$55.61. That gap points to the shares trading at a sizeable discount, so the real question is whether you think the cash flow assumptions are realistic or not.
Look into how the SWS DCF model arrives at its fair value.
Simply Wall St performs a discounted cash flow (DCF) on every stock in the world every day (check out Buckle for example). We show the entire calculation in full. You can track the result in your watchlist or portfolio and be alerted when this changes, or use our stock screener to discover 877 undervalued stocks based on their cash flows. If you save a screener we even alert you when new companies match - so you never miss a potential opportunity.
Build Your Own Buckle Narrative
If you see the numbers differently or want to stress test your own assumptions, you can build a personalized Buckle view in just a few minutes, starting with Do it your way.
A great starting point for your Buckle research is our analysis highlighting 3 key rewards and 1 important warning sign that could impact your investment decision.
Looking for more investment ideas?
If Buckle has your attention, do not stop here. The market offers plenty of other angles that could fit your goals and risk comfort better.
- Target steady income potential by scanning these 12 dividend stocks with yields > 3% that may suit a portfolio focused on regular cash returns.
- Position yourself early in fast moving themes by checking out these 27 AI penny stocks shaping the future of automation and data driven decision making.
- Hunt for potential bargains by reviewing these 877 undervalued stocks based on cash flows that our models flag as trading below their estimated cash flow value.
This article by Simply Wall St is general in nature. We provide commentary based on historical data and analyst forecasts only using an unbiased methodology and our articles are not intended to be financial advice. It does not constitute a recommendation to buy or sell any stock, and does not take account of your objectives, or your financial situation. We aim to bring you long-term focused analysis driven by fundamental data. Note that our analysis may not factor in the latest price-sensitive company announcements or qualitative material. Simply Wall St has no position in any stocks mentioned.
Have feedback on this article? Concerned about the content? Get in touch with us directly. Alternatively, email editorial-team@simplywallst.com