
- PREMIUM
- LIVE QUOTES
- INSTITUTIONS
 Index Options
 State Street
 CME Group
 Nasdaq
 Cboe
Cboe TradingView
 Wall Street Journal
Is It Too Late To Consider Mirum Pharmaceuticals (MIRM) After A 95% One-Year Rally?
- If you are wondering whether Mirum Pharmaceuticals' share price still offers value at around US$81.98, it helps to step back and look at what the current market price is really implying.
- The stock has delivered returns of 3.8% over the last 7 days, 20.7% over the last 30 days, 5.0% year to date and 95.2% over the last year, with a multi year return of 293.6% across three years and 320.8% across five years. These figures may catch the eye of growth focused investors.
- Recent share price moves sit against a backdrop of ongoing attention on Mirum as a pharmaceutical and biotech name on the Nasdaq, together with continuing interest in its pipeline and commercial assets. This mix of short term and multi year returns has naturally raised questions about how much optimism is already reflected in the valuation.
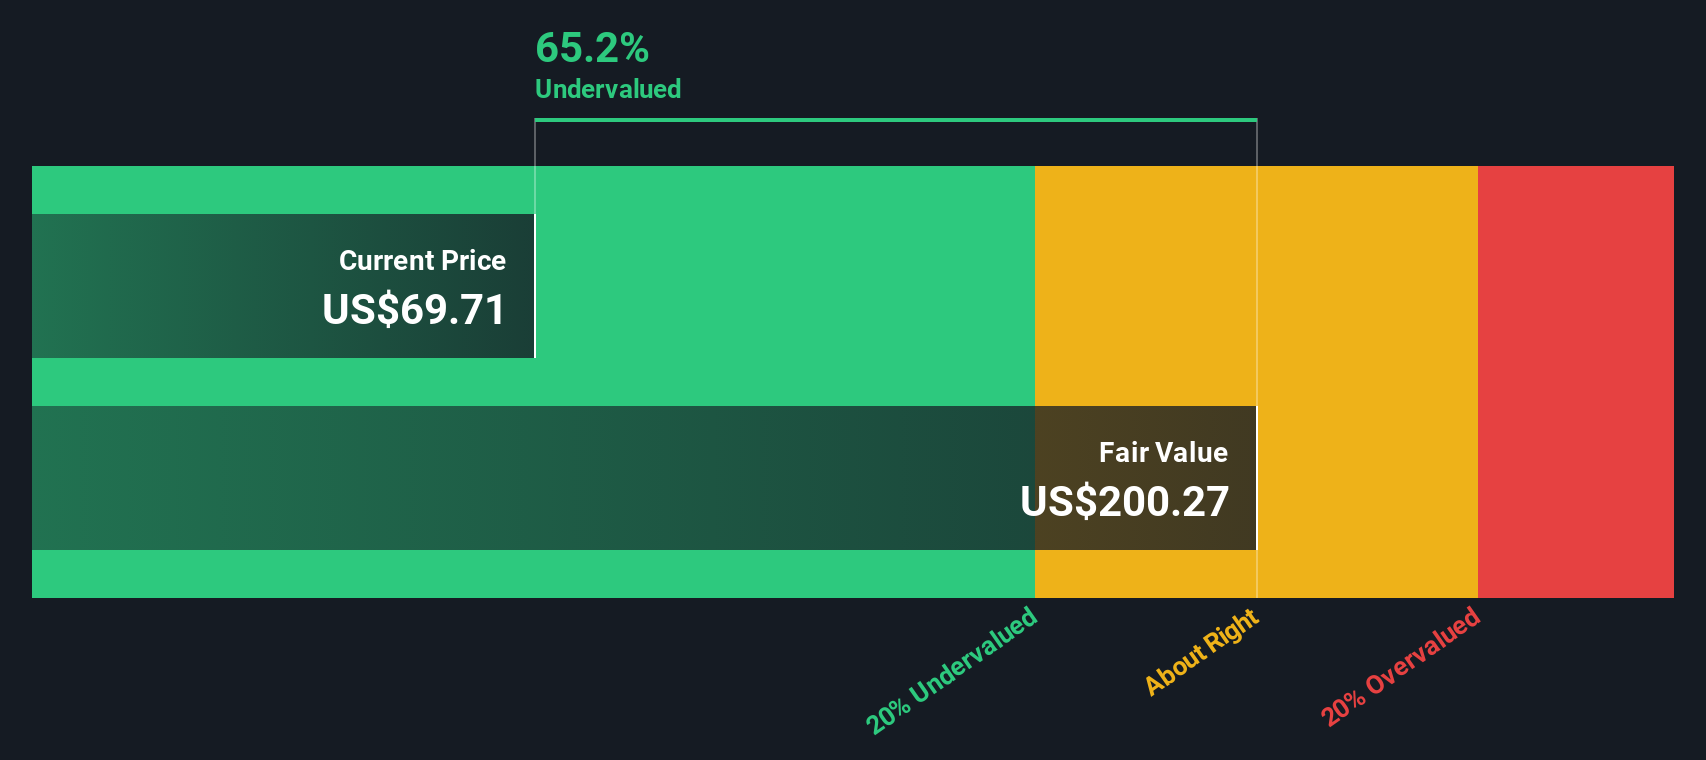
- On Simply Wall St's 6 point valuation framework, Mirum scores 4 out of 6, suggesting that several checks point to the shares being undervalued. We will unpack this using a range of valuation approaches before finishing with a broader way to think about what the market might be missing.
Approach 1: Mirum Pharmaceuticals Discounted Cash Flow (DCF) Analysis
A Discounted Cash Flow, or DCF, model estimates what a company might be worth by projecting its future cash flows and then discounting those back to today to get a single present value figure.
For Mirum Pharmaceuticals, Simply Wall St uses a 2 Stage Free Cash Flow to Equity model based on cash flows in $. The latest twelve month free cash flow (FCF) is reported at about $23.39 million. Analyst estimates and subsequent extrapolations point to projected FCF of $480.67 million in 2030, with intermediate years rising from a projected $37.67 million in 2026 to $913.03 million in 2035, all expressed before discounting.
After discounting those projected cash flows back to today, the model arrives at an estimated intrinsic value of US$294.01 per share. Compared with the current share price of around US$81.98, this implies a 72.1% discount, which indicates the shares appear significantly undervalued on this DCF framework.
Result: UNDERVALUED
Our Discounted Cash Flow (DCF) analysis suggests Mirum Pharmaceuticals is undervalued by 72.1%. Track this in your watchlist or portfolio, or discover 879 more undervalued stocks based on cash flows.
Approach 2: Mirum Pharmaceuticals Price vs Sales
For a company like Mirum Pharmaceuticals, where investors often focus on commercial uptake and pipeline potential, the price to sales, or P/S, ratio is a useful way to relate the share price to current revenue. Higher growth expectations or lower perceived risk tend to justify a higher “normal” P/S multiple, while slower growth or higher risk usually point to a lower one.
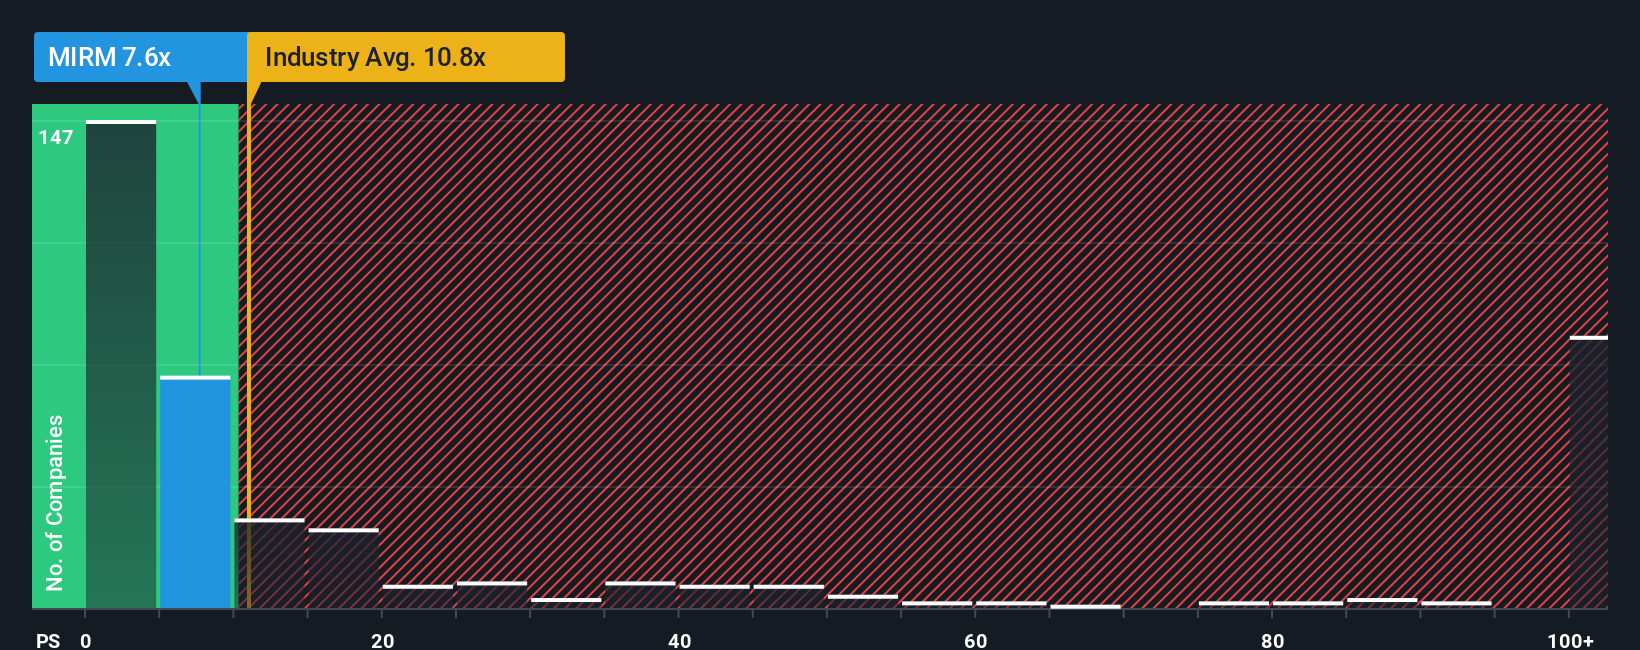
Mirum’s current P/S ratio is 8.98x. That compares with an average of 12.13x for the broader Biotechs industry and around 10.21x across Mirum’s peer group. Simply Wall St also calculates a proprietary “Fair Ratio” of 8.00x, which reflects what the P/S might be expected to be given factors such as Mirum’s earnings growth profile, profit margins, industry, market cap and risk characteristics.
This Fair Ratio is designed to be more tailored than a simple comparison with peers or the sector, because it adjusts for company specific features rather than assuming all biotechs deserve the same multiple. Lining up the Fair Ratio of 8.00x against the current 8.98x suggests the shares trade above that level, indicating they appear overvalued on this metric.
Result: OVERVALUED
P/S ratios tell one story, but what if the real opportunity lies elsewhere? Discover 1446 companies where insiders are betting big on explosive growth.
Upgrade Your Decision Making: Choose your Mirum Pharmaceuticals Narrative
Earlier we mentioned that there is an even better way to understand valuation. On Simply Wall St you can use Narratives to attach your own story about Mirum Pharmaceuticals to the numbers. You can link what you believe about factors like Livmarli, volixibat, Fragile X, revenue, earnings, margins and risk to a forecast and fair value on the Community page. You can then compare that fair value with the current price to decide whether Mirum looks attractive or expensive for you. The Narrative automatically updates as new news or earnings arrive. A bullish investor might build a Narrative closer to the US$95 upper analyst target, while a cautious investor might lean toward the US$53 lower target, yet both are using the same tool to express very different views.
Do you think there's more to the story for Mirum Pharmaceuticals? Head over to our Community to see what others are saying!

This article by Simply Wall St is general in nature. We provide commentary based on historical data and analyst forecasts only using an unbiased methodology and our articles are not intended to be financial advice. It does not constitute a recommendation to buy or sell any stock, and does not take account of your objectives, or your financial situation. We aim to bring you long-term focused analysis driven by fundamental data. Note that our analysis may not factor in the latest price-sensitive company announcements or qualitative material. Simply Wall St has no position in any stocks mentioned.
Have feedback on this article? Concerned about the content? Get in touch with us directly. Alternatively, email editorial-team@simplywallst.com