
- PREMIUM
- LIVE QUOTES
- INSTITUTIONS
 Index Options
 State Street
 CME Group
 Nasdaq
 Cboe
Cboe TradingView
 Wall Street Journal
Is NextEra Energy (NEE) Fairly Priced After Multi Year Gains And Recent Utility Sector Reassessment
- If you are wondering whether NextEra Energy's current share price lines up with its underlying value, this article walks through the key numbers that matter for you as a shareholder or a potential investor.
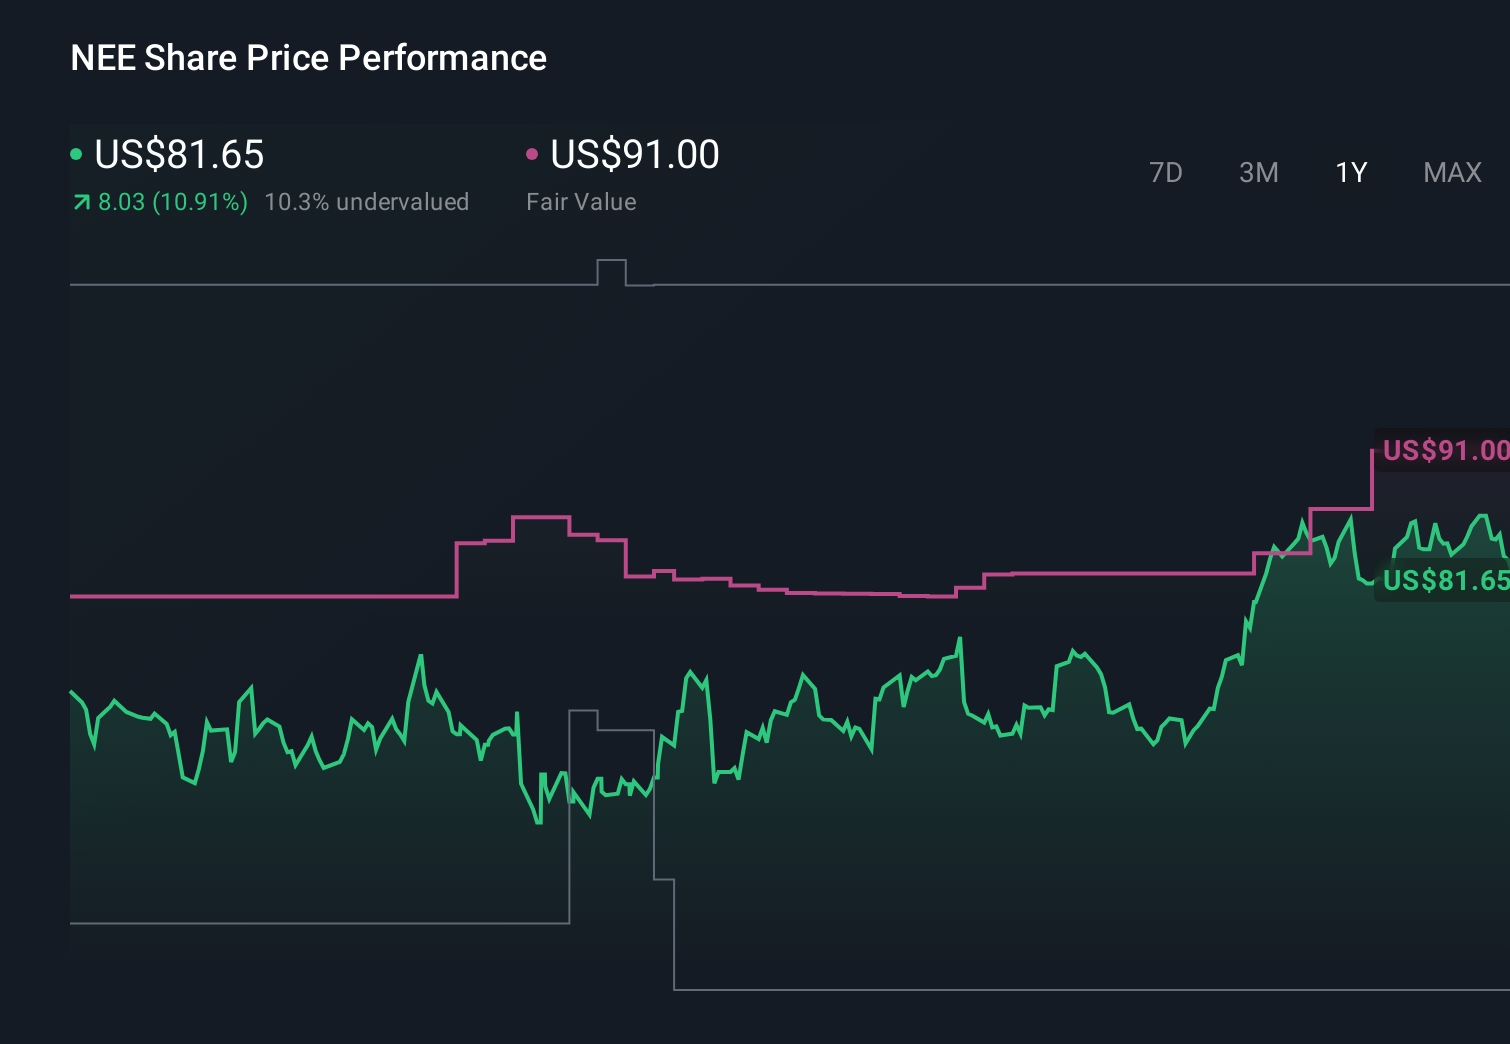
- The stock most recently closed at US$79.49, with a 1% decline over the last 7 days, a 0.2% decline over 30 days, a 1.8% decline year to date, a 16% gain over the past year, and positive returns over 3 and 5 years.
- Recent coverage around NextEra Energy has focused on how investors are reassessing large US utilities and renewables players and what that means for capital allocation and long term growth plans. This changing attention helps explain why the share price has moved differently over shorter periods compared with its 1 year and multi year returns.
- NextEra Energy currently has a valuation score of 1 out of 6, which flags that only a small part of our standard checks points to undervaluation. Next, we will walk through the main valuation approaches investors often rely on, and then come back to a broader way of thinking about what the stock might be worth.
NextEra Energy scores just 1/6 on our valuation checks. See what other red flags we found in the full valuation breakdown.
Approach 1: NextEra Energy Dividend Discount Model (DDM) Analysis
The Dividend Discount Model estimates what a stock might be worth by projecting future dividends, applying an assumed growth rate, and discounting those payments back to today. It is essentially asking what a stream of dividends is worth in today’s dollars.
For NextEra Energy, the model uses an annual dividend per share of US$2.67, a return on equity of 9.51% and a payout ratio of about 61%. Dividend growth in the model is capped at 3.26%, slightly below the 3.71% expected growth input, and compares with a broader expected growth figure of about 3.71%. This framework focuses on whether the current dividend level and its projected growth look sustainable relative to earnings and returns on equity.
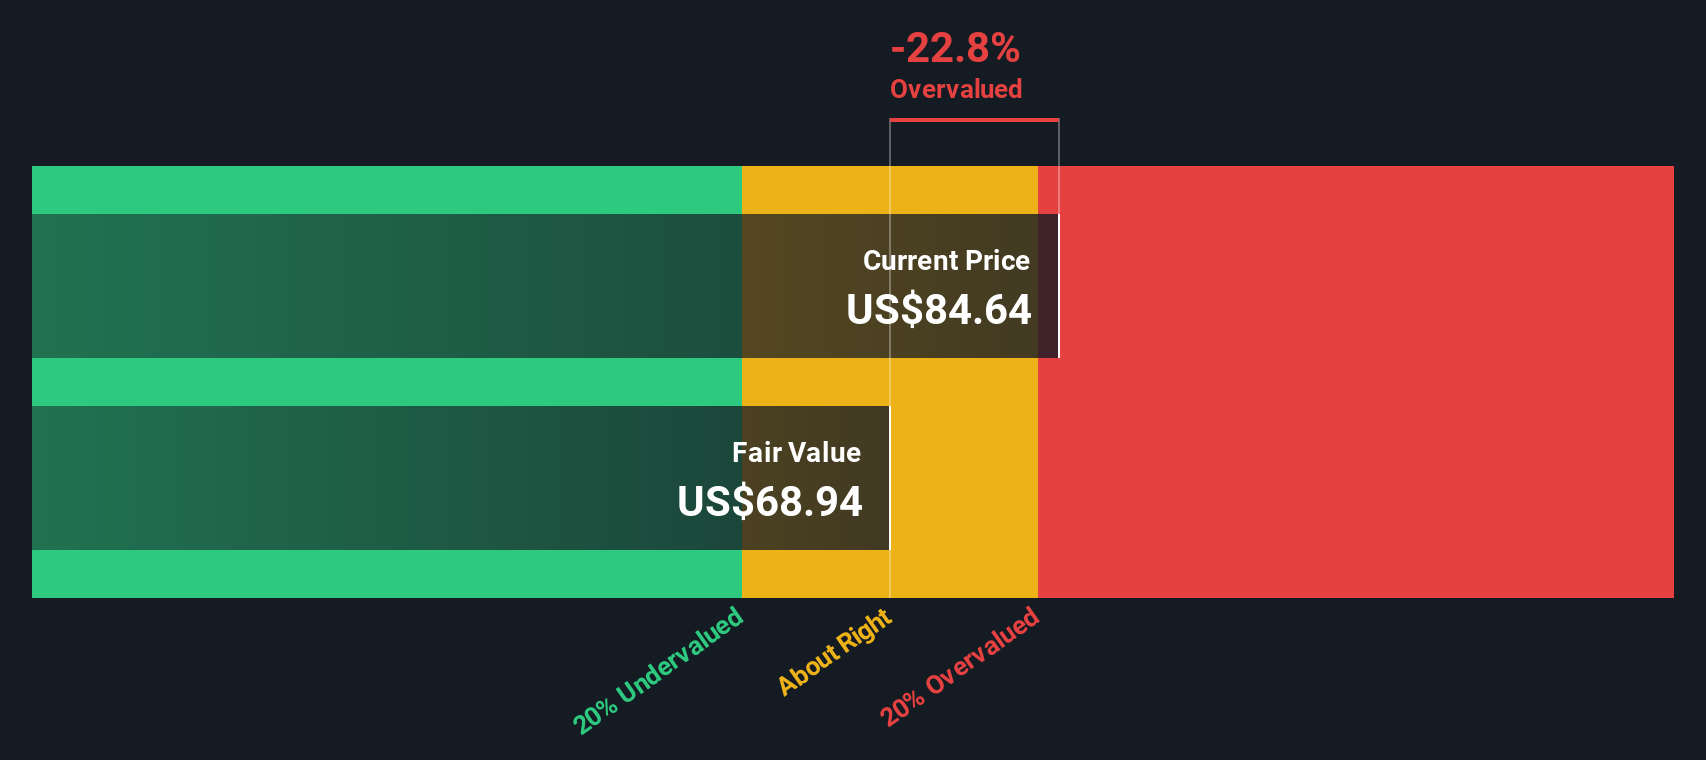
Putting those inputs together, the DDM output points to an estimated intrinsic value of roughly US$72.19 per share. Compared with the recent share price of US$79.49, that implies the stock is about 10.1% overvalued on this dividend-based view.
Result: OVERVALUED
Our Dividend Discount Model (DDM) analysis suggests NextEra Energy may be overvalued by 10.1%. Discover 881 undervalued stocks or create your own screener to find better value opportunities.
Approach 2: NextEra Energy Price vs Earnings
For a profitable company like NextEra Energy, the P/E ratio is a useful shorthand for how much investors are currently paying for each dollar of earnings. It helps you compare what the market is willing to pay here versus other utility stocks using a common yardstick.
What counts as a “normal” P/E depends on what investors expect for future earnings growth and how risky they think those earnings are. Higher expected growth or lower perceived risk can support a higher P/E, while slower expected growth or higher perceived risk usually calls for a lower one.
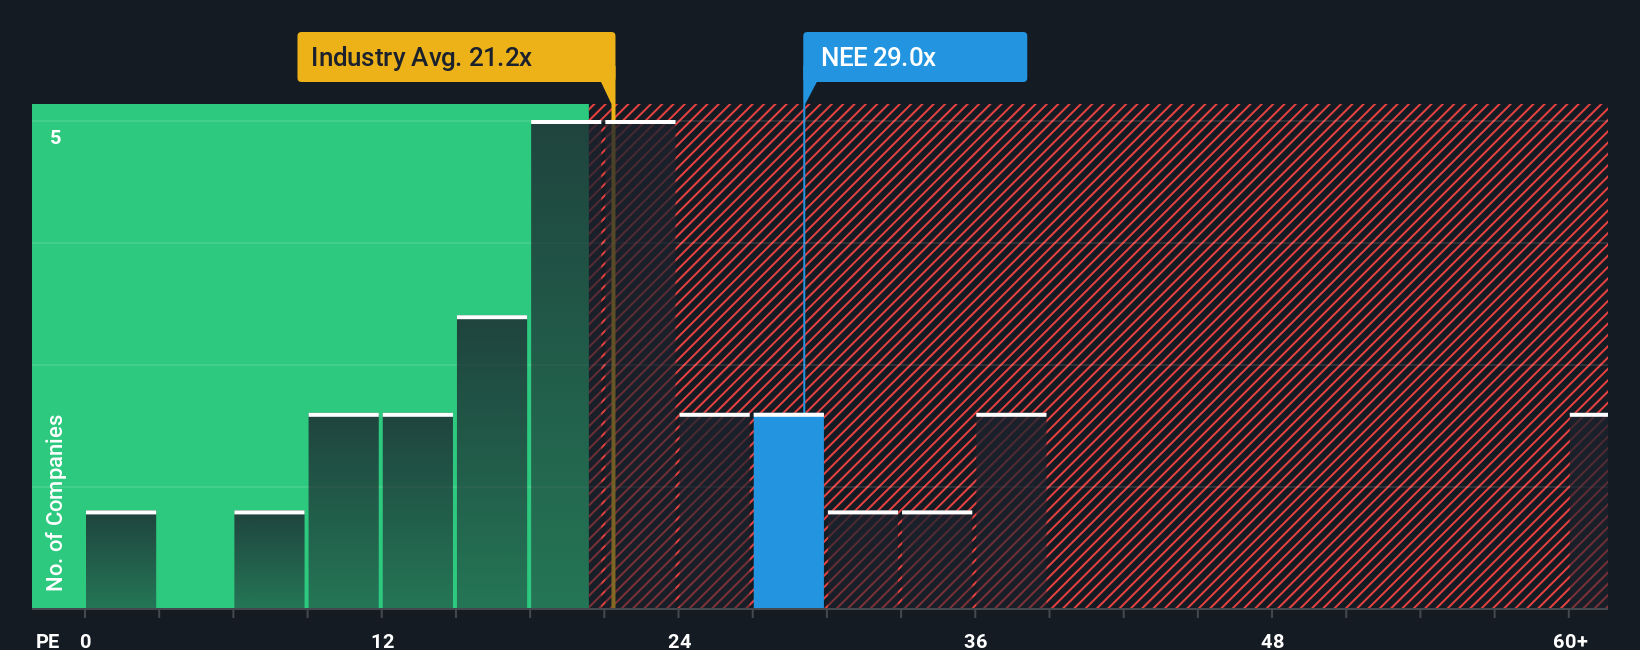
NextEra Energy currently trades on a P/E of 25.46x, compared with an Electric Utilities industry average of 19.98x and a peer average of 23.44x. Simply Wall St’s Fair Ratio for NextEra Energy is 27.83x, which is its proprietary view of what the P/E “should” be given the company’s earnings growth profile, profit margins, size, risk factors and industry.
The Fair Ratio goes a step further than simple peer or industry comparisons because it adjusts for company specific characteristics rather than assuming all utilities deserve the same multiple. Since the Fair Ratio of 27.83x is higher than the current P/E of 25.46x, this approach suggests the shares are UNDERVALUED.
Result: UNDERVALUED
P/E ratios tell one story, but what if the real opportunity lies elsewhere? Discover 1446 companies where insiders are betting big on explosive growth.
Upgrade Your Decision Making: Choose your NextEra Energy Narrative
Earlier we mentioned that there is an even better way to understand valuation, so let us introduce you to Narratives, where you connect your view of NextEra Energy’s business to your own forecast for revenue, earnings and margins, and then to a Fair Value that you can compare directly with today’s price.
A Narrative is simply your story about the company, written in numbers as well as words, so you can say why you think NextEra Energy’s future looks a certain way and then see what that implies for its share price.
On Simply Wall St, Narratives sit inside the Community page and are used by millions of investors as an easy, visual tool that links a company’s story, a forward looking financial model and a Fair Value estimate in one place.
You can then compare that Fair Value to the current market price to help you decide whether you see the stock as offering enough upside or looking fully priced for your assumptions.
Narratives also update when fresh information like earnings releases, policy news or new projects is added to the platform, so your Fair Value view can stay aligned with what is happening at the company.
For example, one NextEra Energy Narrative on Simply Wall St currently anchors around a Fair Value near US$91.14, while another sits closer to US$103.00. This shows how two investors can look at the same company and reach different yet clearly reasoned conclusions about what the shares might be worth.
Do you think there's more to the story for NextEra Energy? Head over to our Community to see what others are saying!
This article by Simply Wall St is general in nature. We provide commentary based on historical data and analyst forecasts only using an unbiased methodology and our articles are not intended to be financial advice. It does not constitute a recommendation to buy or sell any stock, and does not take account of your objectives, or your financial situation. We aim to bring you long-term focused analysis driven by fundamental data. Note that our analysis may not factor in the latest price-sensitive company announcements or qualitative material. Simply Wall St has no position in any stocks mentioned.
Have feedback on this article? Concerned about the content? Get in touch with us directly. Alternatively, email editorial-team@simplywallst.com