
- PREMIUM
- LIVE QUOTES
- INSTITUTIONS
 Index Options
 State Street
 CME Group
 Nasdaq
 Cboe
Cboe TradingView
 Wall Street Journal
Is It Too Soon To Reassess Circle Internet Group (CRCL) After NYSE Listing And USDC Focus?
- If you are wondering whether Circle Internet Group at around US$80.59 is a bargain or just expensive hype, you are not alone. That is exactly what this article is going to unpack.
- The share price has been fairly active recently, with a 1.6% return over the last 7 days, a 4.0% decline over the last 30 days, and a 3.5% decline year to date. This raises questions about how the market is reassessing its potential and risk.
- Recent coverage around Circle has focused on its role in the USDC stablecoin ecosystem and its NYSE listing. This has drawn attention to how public market investors might price a business tied closely to digital assets. At the same time, discussion about regulation and adoption of stablecoins has kept sentiment in the spotlight and helps frame the recent price moves.
- On our checks, Circle Internet Group currently scores 1 out of 6 on valuation, as shown in the valuation scorecard. Next, we will look at how different methods such as multiples and cash flow models line up, before finishing with a more practical way to judge value that many investors overlook.
Circle Internet Group scores just 1/6 on our valuation checks. See what other red flags we found in the full valuation breakdown.
Approach 1: Circle Internet Group Discounted Cash Flow (DCF) Analysis
A Discounted Cash Flow model takes the cash Circle Internet Group is expected to generate in the future and discounts those amounts back to what they might be worth in today’s dollars. It is essentially asking what those future cash flows are worth right now.
Circle’s latest twelve month Free Cash Flow (FCF) is reported at about $329.2 million. Analysts have provided specific FCF estimates out to 2030, for example $434.7 million in 2026 and $738.1 million in 2030, with further yearly figures out to 2035 extrapolated by Simply Wall St rather than coming directly from analyst forecasts.
Using these projections in a 2 Stage Free Cash Flow to Equity model, Simply Wall St arrives at an estimated intrinsic value of about $61.83 per share for NYSE:CRCL. Against a current share price of roughly $80.59, the implied DCF discount suggests the stock is about 30.3% overvalued on this measure.
Result: OVERVALUED
Our Discounted Cash Flow (DCF) analysis suggests Circle Internet Group may be overvalued by 30.3%. Discover 883 undervalued stocks or create your own screener to find better value opportunities.
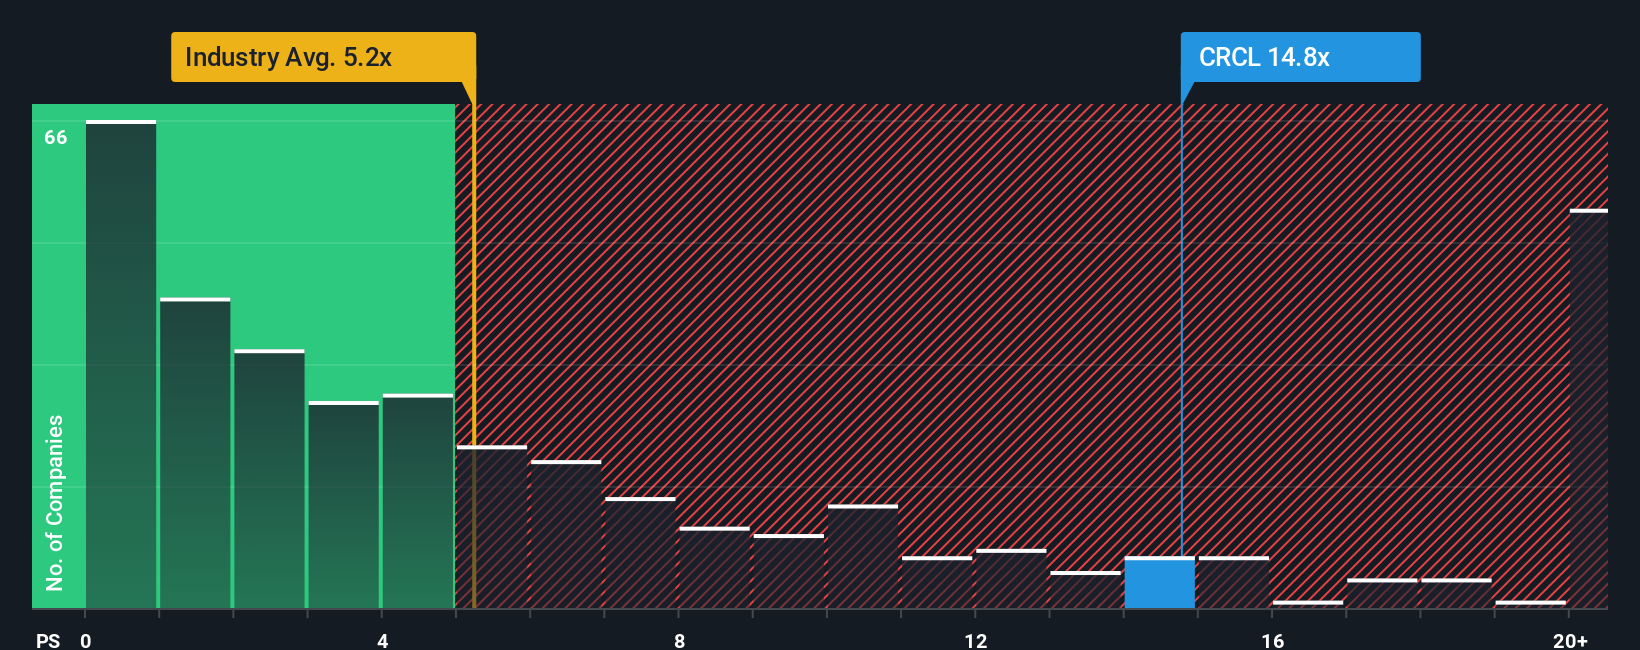
Approach 2: Circle Internet Group Price vs Sales
For companies where earnings are not yet a steady guide, the P/S ratio is often more useful than P/E because it compares the value of the business to its revenue rather than its current profit level. Investors usually accept a higher or lower P/S depending on what they expect for future growth and how risky they think that revenue stream is, so there is no single “right” number.
Circle Internet Group currently trades on a P/S of about 7.87x. That sits above the broader Software industry average of 4.91x, but below the peer group average of 11.02x provided in this dataset. To go a step further, Simply Wall St calculates a proprietary “Fair Ratio” of 4.26x for Circle. This is the P/S level it might trade on given factors such as its earnings growth profile, industry, profit margin, market cap and risk characteristics.
This Fair Ratio can be more informative than a simple industry or peer comparison because it attempts to adjust for Circle’s own mix of growth, profitability, risk and size instead of assuming one blanket benchmark. With the current P/S of 7.87x sitting above the Fair Ratio of 4.26x, the multiple suggests the shares are pricing in more optimism than that model implies.
Result: OVERVALUED
P/S ratios tell one story, but what if the real opportunity lies elsewhere? Discover 1446 companies where insiders are betting big on explosive growth.
Upgrade Your Decision Making: Choose your Circle Internet Group Narrative
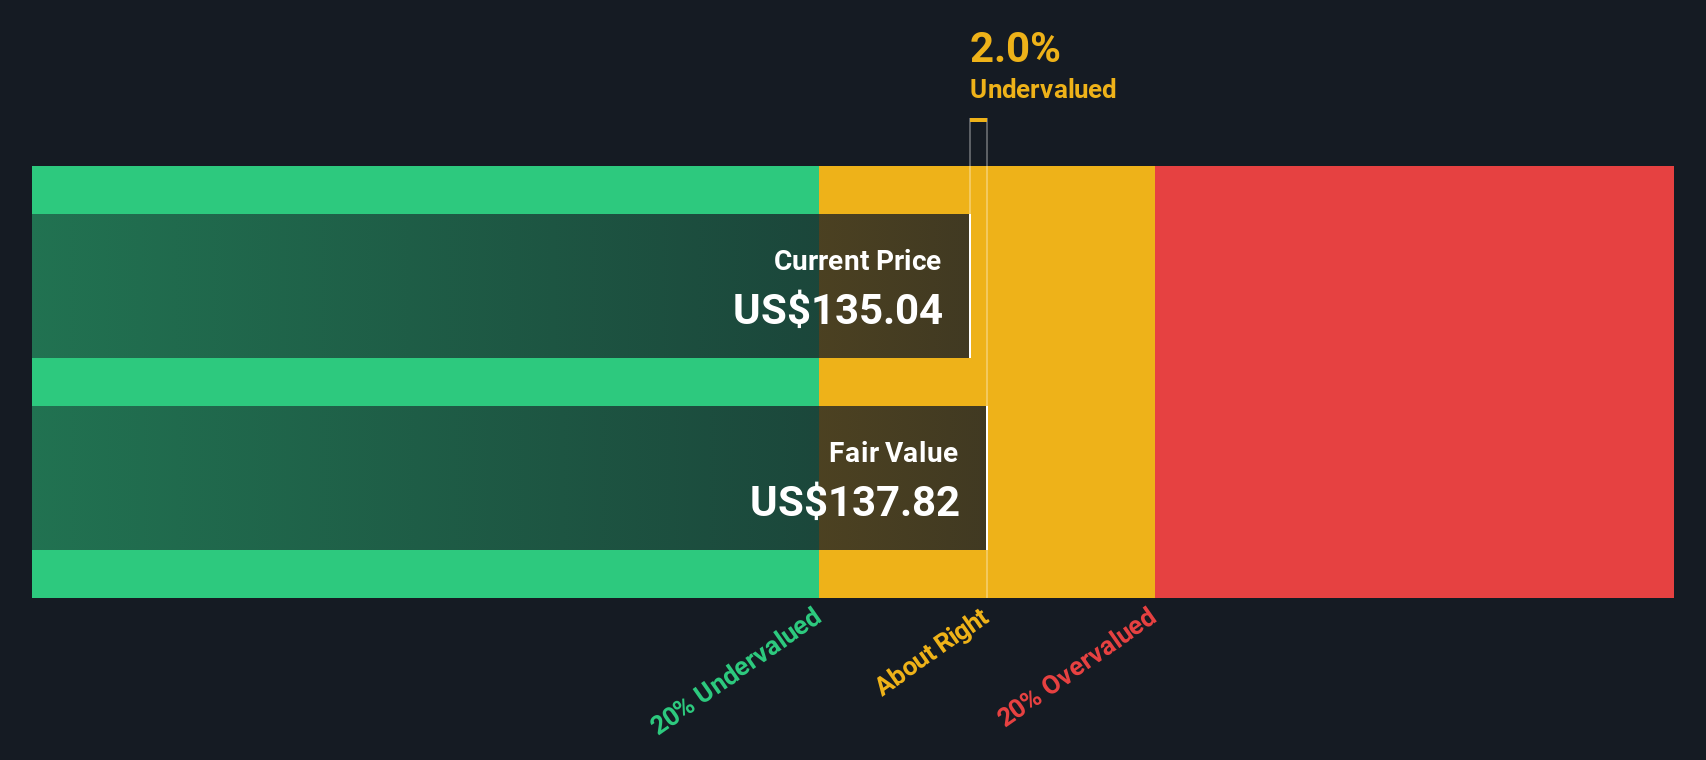
Earlier we mentioned that there is an even better way to understand valuation, so let us introduce you to Narratives, a simple way for you to attach a clear story to your numbers. This links your view of Circle Internet Group’s business to a forecast for revenue, earnings and margins, and then to a Fair Value that you can compare directly with today’s share price.
On Simply Wall St’s Community page, you can pick or build a Narrative for Circle and set your own assumptions. You can then see how your Fair Value stacks up against other investors who might, for example, see Circle as a high upside play on USDC and assign a Fair Value around US$326 per share, or take a more cautious view with a Fair Value closer to US$122 per share. All of this updates automatically as new news, earnings and regulatory developments come through to help you decide whether the current price of about US$80.59 looks attractive, stretched, or somewhere in between.
Do you think there's more to the story for Circle Internet Group? Head over to our Community to see what others are saying!

This article by Simply Wall St is general in nature. We provide commentary based on historical data and analyst forecasts only using an unbiased methodology and our articles are not intended to be financial advice. It does not constitute a recommendation to buy or sell any stock, and does not take account of your objectives, or your financial situation. We aim to bring you long-term focused analysis driven by fundamental data. Note that our analysis may not factor in the latest price-sensitive company announcements or qualitative material. Simply Wall St has no position in any stocks mentioned.
Have feedback on this article? Concerned about the content? Get in touch with us directly. Alternatively, email editorial-team@simplywallst.com