
Is It Too Late To Consider Cameco (TSX:CCO) After Its 95% One Year Surge?
- If you are wondering whether Cameco at C$143.89 still offers value or if the easy gains are behind it, you are not alone.
- The share price return figures are eye catching, with 14.5% over the last 7 days, 14.2% over the last 30 days, 6.3% year to date and 95.2% over the last year, on top of a very large 5 year gain that is close to 7x.
- Recent news coverage around uranium supply, energy security and long term nuclear power plans has kept Cameco in focus for investors, as many are reassessing how nuclear fits into future energy mixes. At the same time, commentary on uranium market tightness and contracting activity has added context to the sharp moves in Cameco's share price.
- Despite those returns, Cameco currently has a valuation score of 0/6. This means our checks do not indicate undervaluation on any of the six metrics we apply. Next we will walk through the different valuation approaches behind that score and then come back to a broader way of thinking about value at the end of the article.
Cameco scores just 0/6 on our valuation checks. See what other red flags we found in the full valuation breakdown.
Approach 1: Cameco Discounted Cash Flow (DCF) Analysis
A DCF model estimates what a company might be worth by projecting future cash flows and discounting them back to today’s value. It is essentially asking what all the future cash Cameco could generate is worth in today’s CA$.
For Cameco, the latest twelve month free cash flow is about CA$1.01b. Analysts have provided specific free cash flow estimates out to 2030, with values such as CA$827.14m for 2026 and CA$1.81b for 2030. Beyond the explicit analyst years, Simply Wall St extends the projections using its own assumptions to build a 2 Stage Free Cash Flow to Equity model, with discounted values calculated for each year out to 2035.
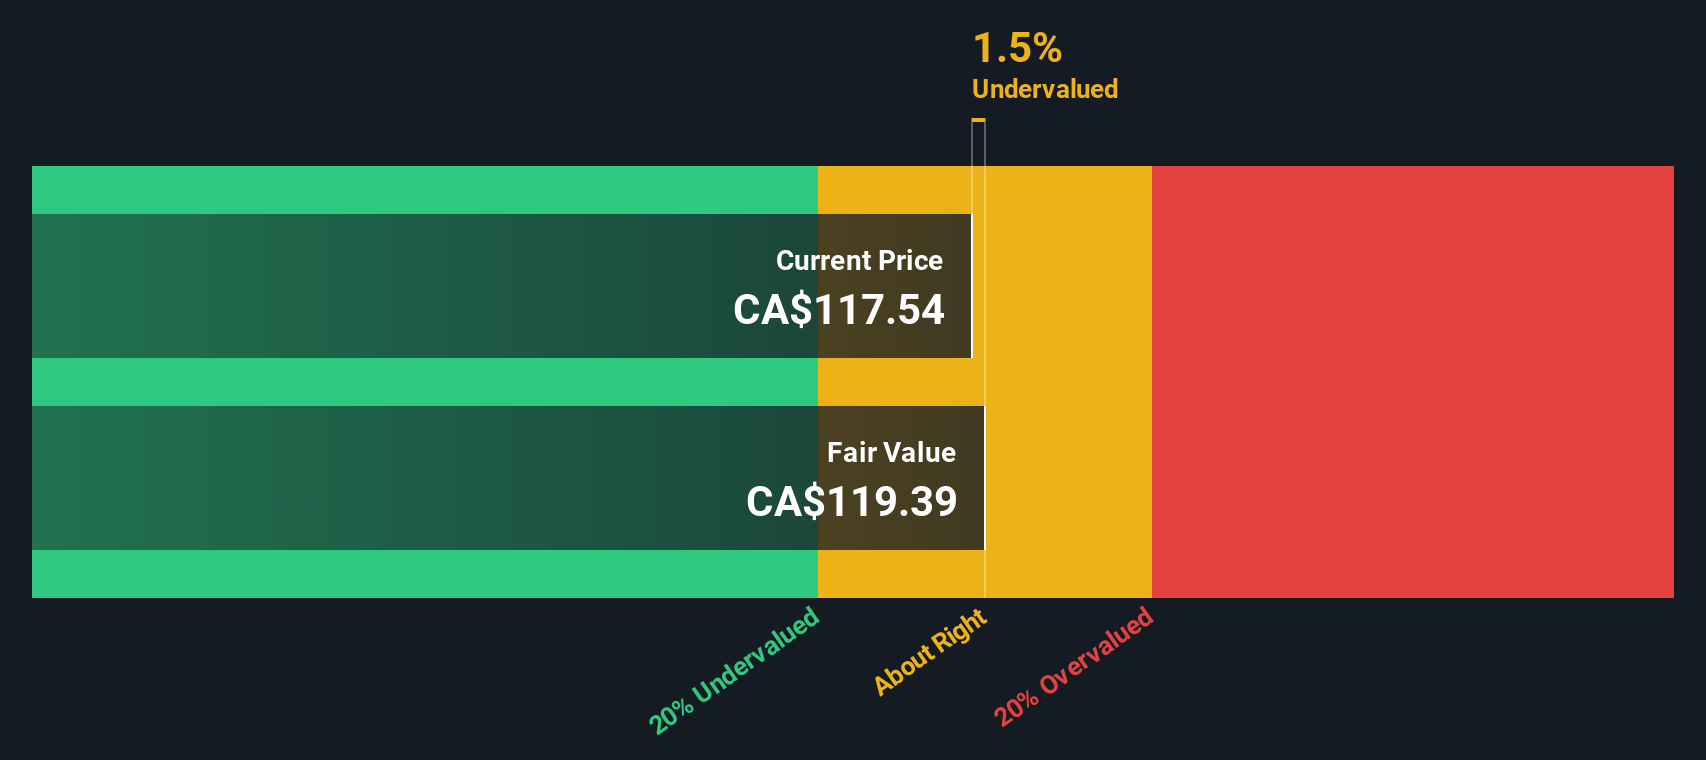
Adding those discounted cash flows together gives an estimated intrinsic value of CA$128.71 per share. Compared to the current share price of about CA$143.89, the model suggests Cameco trades at roughly an 11.8% premium to this DCF estimate. On this measure the stock appears overvalued rather than cheap.
Result: OVERVALUED
Our Discounted Cash Flow (DCF) analysis suggests Cameco may be overvalued by 11.8%. Discover 883 undervalued stocks or create your own screener to find better value opportunities.
Approach 2: Cameco Price vs Earnings
For a profitable company like Cameco, the P/E ratio is a straightforward way to relate what you pay for each share to the earnings that support it. It lets you compare how the market prices each dollar of earnings across different businesses.
What counts as a “normal” P/E depends on what investors expect for future earnings growth and how much risk they see. Higher expected growth or lower perceived risk can justify a higher P/E, while slower growth or higher risk tends to pull it down.
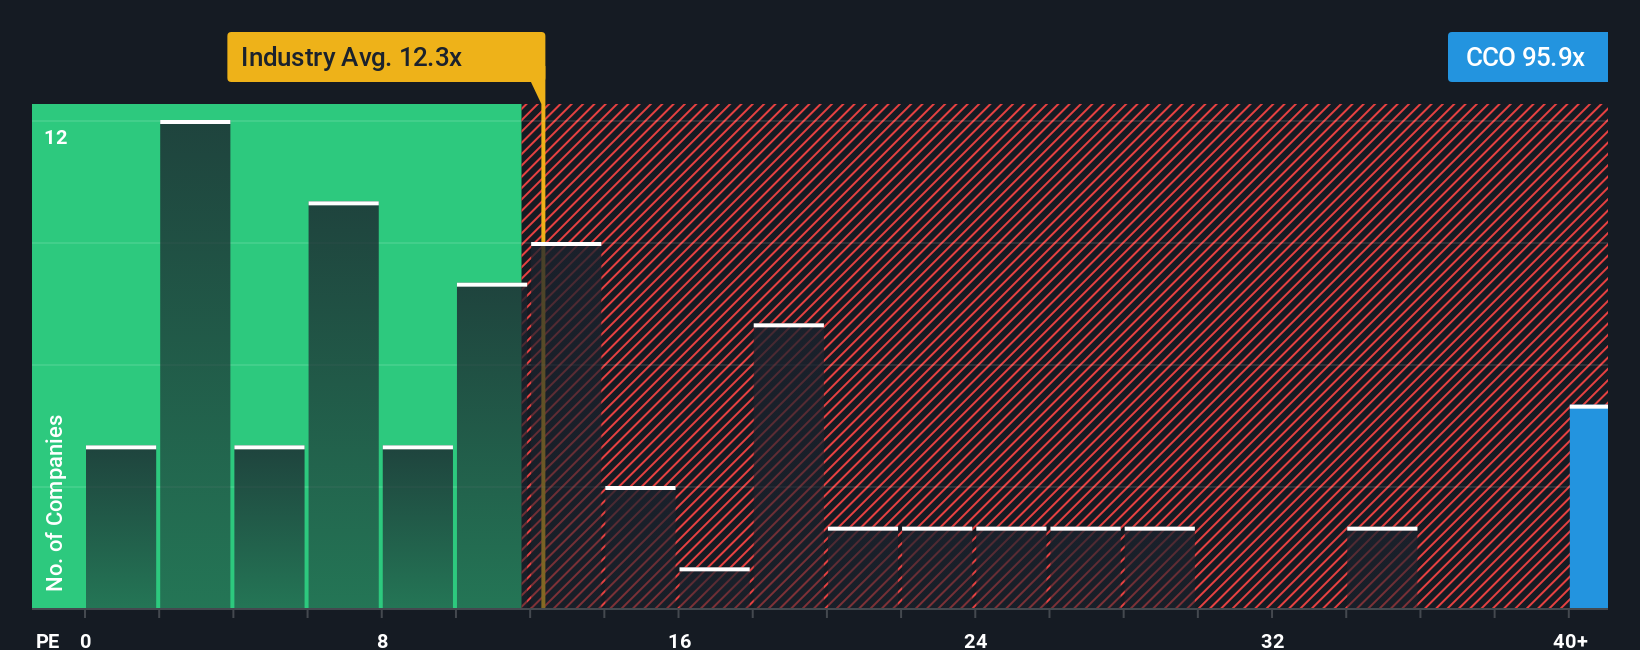
Cameco currently trades on a P/E of 119.11x. That stands well above the Oil and Gas industry average of 14.24x and also above the peer average of 15.61x. To add more context, Simply Wall St calculates a proprietary “Fair Ratio” of 19.97x for Cameco. This reflects its earnings growth outlook, industry, profit margins, market cap and risk profile.
The Fair Ratio is more tailored than a simple industry or peer comparison because it attempts to adjust for the specific characteristics of Cameco rather than treating all companies as if they were identical.
Comparing the Fair Ratio of 19.97x with the current P/E of 119.11x suggests the shares trade well above this fair value estimate.
Result: OVERVALUED
P/E ratios tell one story, but what if the real opportunity lies elsewhere? Discover 1446 companies where insiders are betting big on explosive growth.
Upgrade Your Decision Making: Choose your Cameco Narrative
Earlier we mentioned that there is an even better way to understand valuation. Let us introduce you to Narratives, which are simple stories you create about a company like Cameco that connect your view of its future revenues, earnings and margins to a financial forecast and a fair value. On Simply Wall St’s Community page you can see how different investors do this. For example, one Narrative ties an optimistic CA$150.81 fair value to expectations for stronger long term revenue growth and margins. Another, more cautious Narrative anchors closer to the lower analyst targets around CA$100.00 by stressing execution and contracting risks. You can then compare each fair value to today’s price to help you decide whether Cameco looks attractive or stretched. These Narratives automatically update as fresh news, guidance or earnings arrive so your story and numbers stay aligned without extra work.
Do you think there's more to the story for Cameco? Head over to our Community to see what others are saying!

This article by Simply Wall St is general in nature. We provide commentary based on historical data and analyst forecasts only using an unbiased methodology and our articles are not intended to be financial advice. It does not constitute a recommendation to buy or sell any stock, and does not take account of your objectives, or your financial situation. We aim to bring you long-term focused analysis driven by fundamental data. Note that our analysis may not factor in the latest price-sensitive company announcements or qualitative material. Simply Wall St has no position in any stocks mentioned.
Have feedback on this article? Concerned about the content? Get in touch with us directly. Alternatively, email editorial-team@simplywallst.com