
Is Motorola Solutions (MSI) Fairly Priced After Recent Share Price Pullback
- If you are wondering whether Motorola Solutions at around US$377 per share is offering fair value right now, you are not alone. The answer depends on which valuation lens you use.
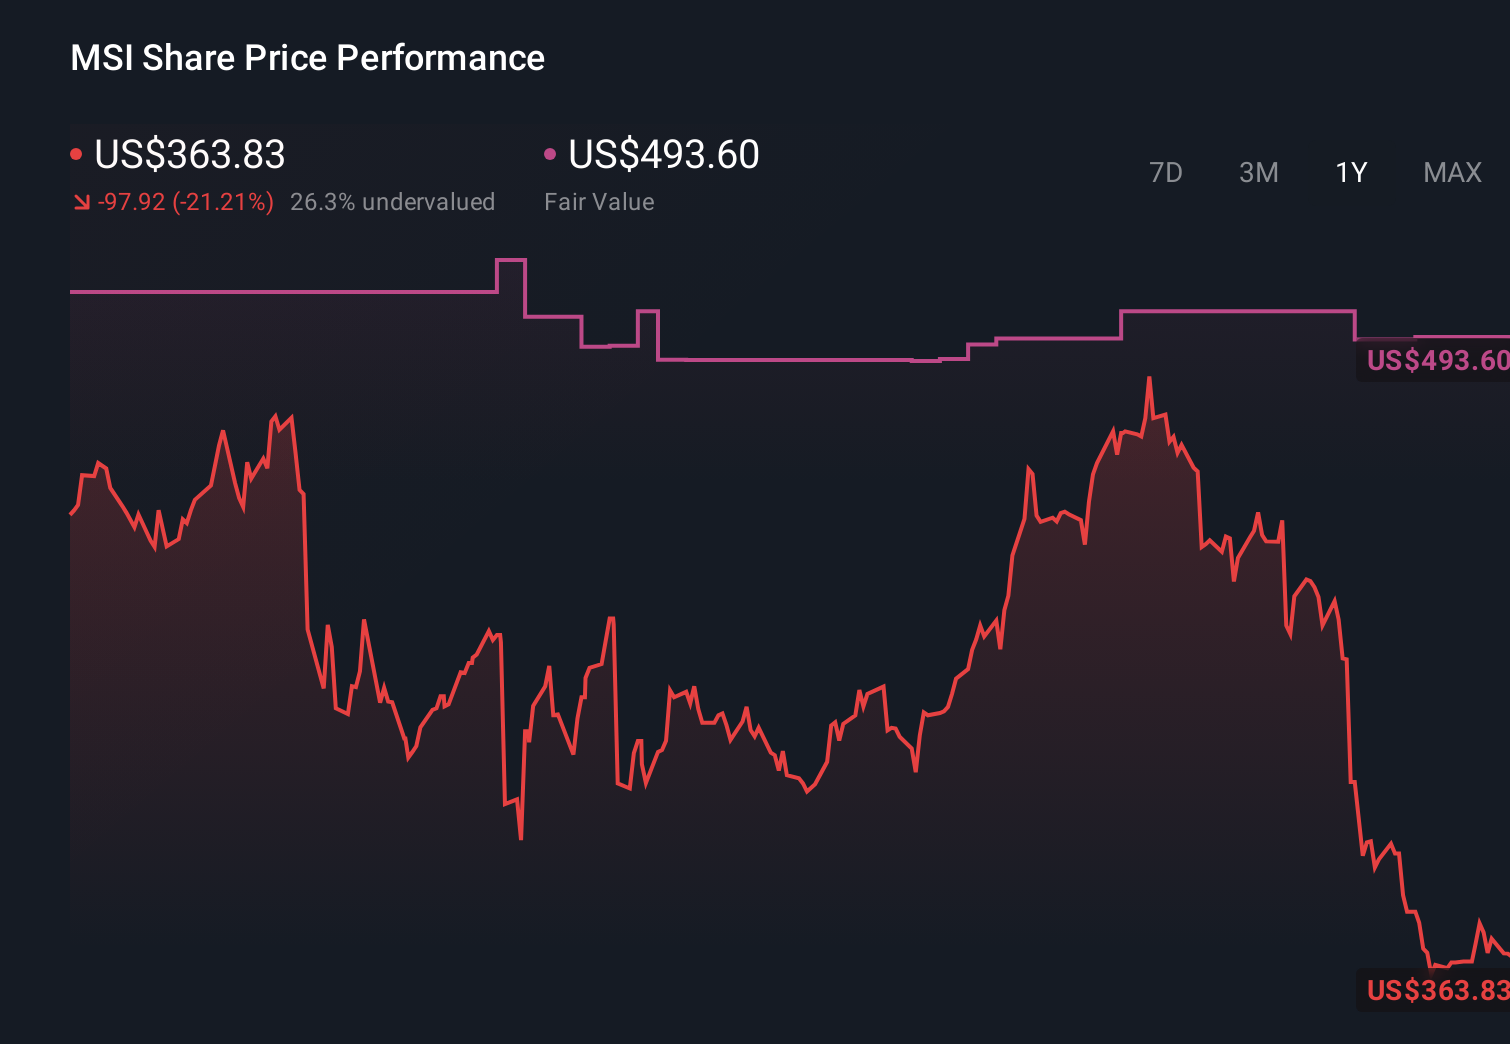
- The stock has seen mixed returns, with a 1.6% gain over the last 30 days but a 17.5% decline over the past year, even though the 3 year and 5 year returns of 47.7% and 130.4% show a much stronger longer term picture.
- Recent headlines have focused on Motorola Solutions as a key provider of critical communications and public safety technology to government and enterprise customers, and investors have been weighing that positioning against changing expectations for future contracts and spending. This broader context helps explain why the share price has pulled back over the last year despite much stronger performance over longer periods.
- On our checks, Motorola Solutions scores 3 out of 6 for value, and you can see the breakdown in the valuation score. Next, we will compare different valuation approaches and then finish with a way to assess value that brings these methods together into a clearer story.
Find out why Motorola Solutions's -17.5% return over the last year is lagging behind its peers.
Approach 1: Motorola Solutions Discounted Cash Flow (DCF) Analysis
A Discounted Cash Flow, or DCF, model takes projected future cash flows and then discounts them back to today to estimate what the entire business might be worth right now.
For Motorola Solutions, the latest twelve month Free Cash Flow (FCF) is about $2.39b. Using a 2 Stage Free Cash Flow to Equity model based on cash flow projections, analysts have provided estimates out to 2029, with Simply Wall St extrapolating further. By 2029, projected FCF is $3.45b, and the ten year path of forecasts and extrapolations runs from about $2.91b in 2026 to roughly $4.39b in 2035, all in $.
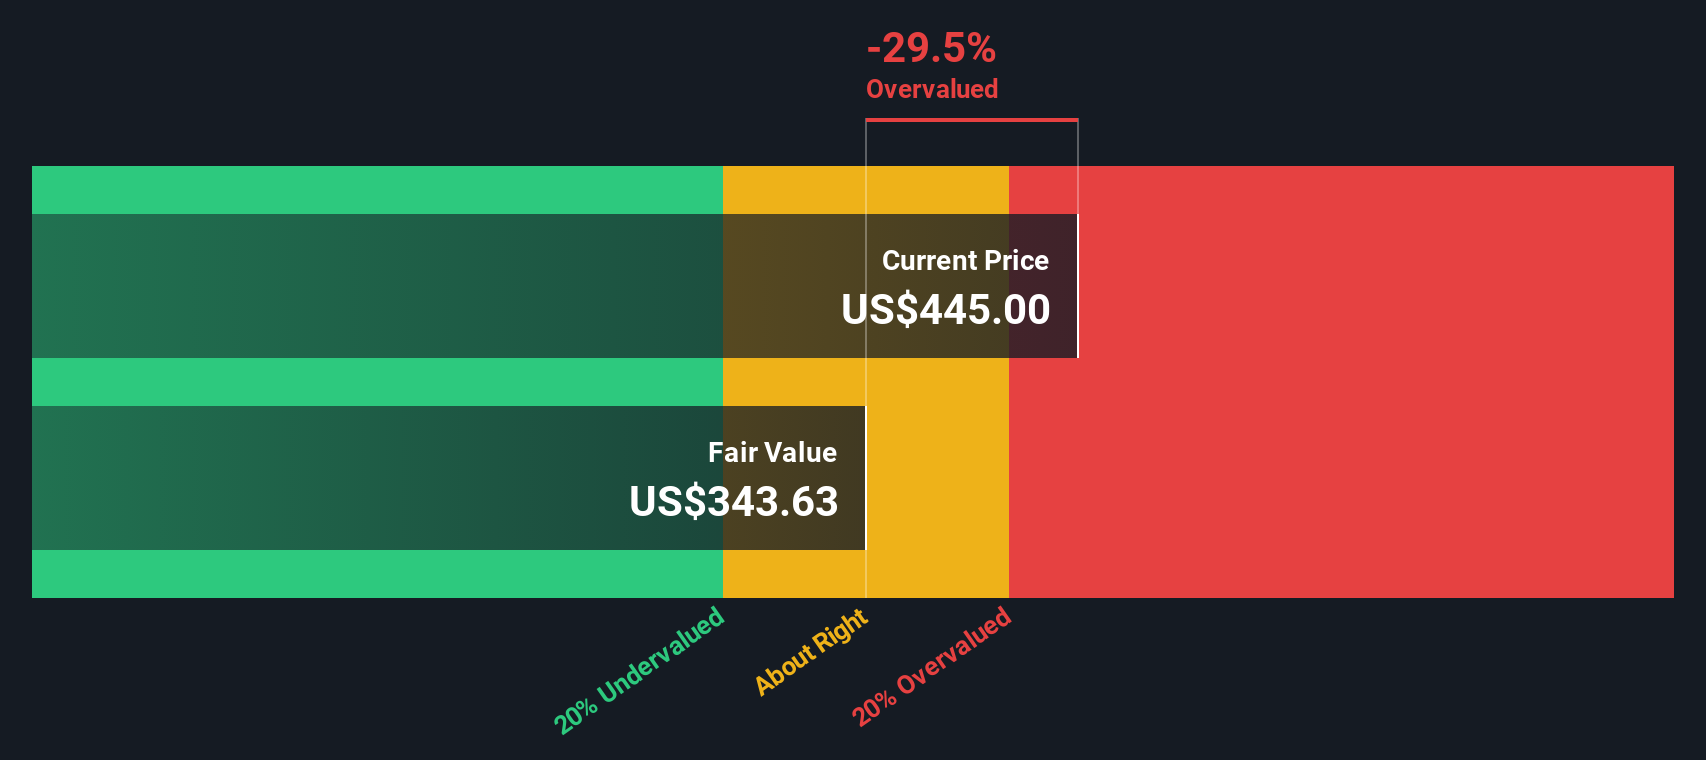
When those projected cash flows are discounted back to today, the DCF model arrives at an estimated intrinsic value of roughly $372.47 per share for NYSE:MSI. Compared with the current share price around $377, the model suggests the stock is about 1.3% overvalued, which is a very small gap.
In short, the DCF view is that Motorola Solutions is priced close to its modeled cash flow value right now.
Result: ABOUT RIGHT
Motorola Solutions is fairly valued according to our Discounted Cash Flow (DCF), but this can change at a moment's notice. Track the value in your watchlist or portfolio and be alerted on when to act.
Approach 2: Motorola Solutions Price vs Earnings
For a profitable business like Motorola Solutions, the P/E ratio is a useful shortcut because it links what you pay per share directly to the earnings that support that share price. In general, higher expected earnings growth and lower risk can justify a higher P/E, while slower growth or higher risk usually point to a lower, more conservative P/E being reasonable.
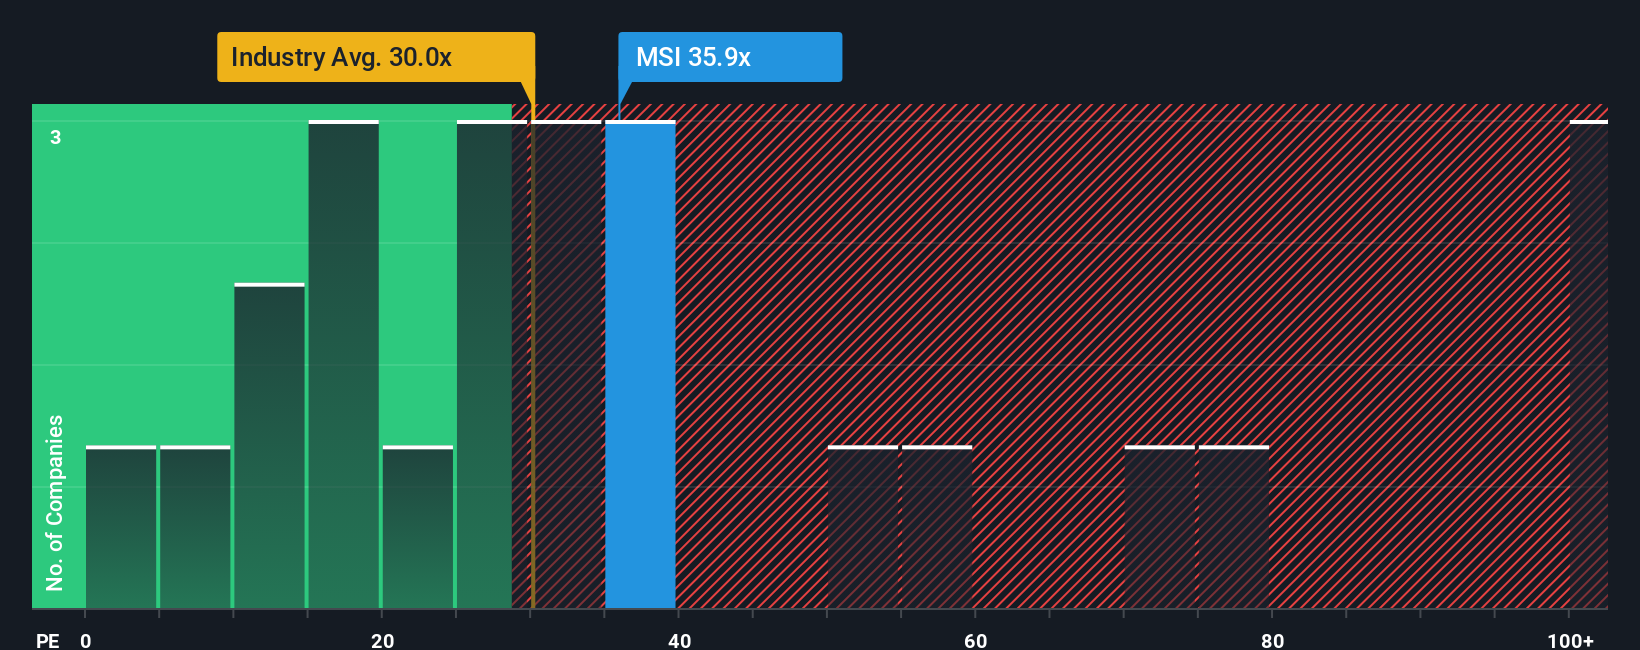
Motorola Solutions currently trades on a P/E of about 29.7x. That sits below the Communications industry average of around 39.5x and below a peer average of roughly 35.7x. On the surface, that might make the stock look relatively inexpensive compared with the broader group.
Simply Wall St also calculates a Fair Ratio of 25.4x for Motorola Solutions. This is its proprietary view of what a suitable P/E might be, after factoring in elements such as earnings growth, profit margins, risk profile, industry, and market cap. Because it is tailored to the company rather than a broad peer set, the Fair Ratio can be a more targeted guide than simple comparisons with industry or peer averages. With the current P/E of 29.7x above the Fair Ratio of 25.4x, the shares screen as somewhat overvalued on this metric.
Result: OVERVALUED
P/E ratios tell one story, but what if the real opportunity lies elsewhere? Discover 1446 companies where insiders are betting big on explosive growth.
Upgrade Your Decision Making: Choose your Motorola Solutions Narrative
Earlier we mentioned that there is an even better way to understand valuation, so let us introduce Narratives, where you connect your own story about Motorola Solutions to a clear set of assumptions on future revenue, earnings, margins and fair value, then compare that fair value with the current price to decide whether the stock looks attractive or not.
On Simply Wall St's Community page, used by millions of investors, Narratives turn this story into a live forecast that updates when new information like earnings or news drops, so your view is always anchored to the latest data rather than a static model.
For example, one Motorola Solutions Narrative on the platform currently pins fair value around US$487.90 based on specific growth, margin and P/E assumptions, while another might sit closer to the current share price. Comparing these side by side helps you see how different expectations about government contracts, recurring software revenue and risks like competition or deal timing translate into very different conclusions about what the shares are worth.
Do you think there's more to the story for Motorola Solutions? Head over to our Community to see what others are saying!
This article by Simply Wall St is general in nature. We provide commentary based on historical data and analyst forecasts only using an unbiased methodology and our articles are not intended to be financial advice. It does not constitute a recommendation to buy or sell any stock, and does not take account of your objectives, or your financial situation. We aim to bring you long-term focused analysis driven by fundamental data. Note that our analysis may not factor in the latest price-sensitive company announcements or qualitative material. Simply Wall St has no position in any stocks mentioned.
Have feedback on this article? Concerned about the content? Get in touch with us directly. Alternatively, email editorial-team@simplywallst.com