
- PREMIUM
- LIVE QUOTES
- INSTITUTIONS
 Index Options
 State Street
 CME Group
 Nasdaq
 Cboe
Cboe TradingView
 Wall Street Journal
Is Rio Tinto (LSE:RIO) Pricing Reflect Recent Share Gains And Cash Flow Outlook
- If you are wondering whether Rio Tinto Group is attractively priced right now, it helps to look at how its current share price lines up with a few different valuation tools.
- The stock last closed at £61.94, with returns of 3.3% over 7 days, 12.0% over 30 days, 3.5% year to date and 36.9% over 1 year, which naturally raises questions about how much of that performance is already reflected in the price.
- Recent news around Rio Tinto Group has largely focused on its position as a major global materials company and how its operations tie into long term demand for commodities. This context is important when you think about whether recent returns of 19.0% over 3 years and 52.4% over 5 years line up with what you are paying today.
- On our valuation checks, Rio Tinto Group currently has a value score of 5/6. This suggests there is more to unpack when you compare different methods like discounted cash flows, multiples and asset based measures. We will also look at a simpler way to make sense of all that at the end of this article.
Find out why Rio Tinto Group's 36.9% return over the last year is lagging behind its peers.
Approach 1: Rio Tinto Group Discounted Cash Flow (DCF) Analysis
A Discounted Cash Flow, or DCF, model estimates what a company could be worth today by projecting its future cash flows and then discounting those back to a present value.
For Rio Tinto Group, the model used is a 2 Stage Free Cash Flow to Equity approach based on cash flow projections. The latest twelve month free cash flow is about US$7.1b. Analysts provide estimates out to 2029, and Simply Wall St extrapolates beyond that, resulting in a projected free cash flow of US$13.6b in 2030 and further estimates up to 2035.
When all those projected cash flows are discounted back to today, the DCF model arrives at an estimated intrinsic value of £84.56 per share. Compared with the recent share price of £61.94, this implies the shares are trading at a 26.8% discount to that intrinsic value according to this model.
Result: UNDERVALUED
Our Discounted Cash Flow (DCF) analysis suggests Rio Tinto Group is undervalued by 26.8%. Track this in your watchlist or portfolio, or discover 883 more undervalued stocks based on cash flows.
Approach 2: Rio Tinto Group Price vs Earnings
For a profitable business, the P/E ratio is a useful way to think about what you are paying for each unit of current earnings. It links the share price directly to the company’s profit, which is often the main driver of long term returns for shareholders.
What counts as a “normal” P/E depends on how the market views a company’s growth prospects and risk. Higher expected growth or lower perceived risk can support a higher P/E, while slower growth or higher risk usually points to a lower one.
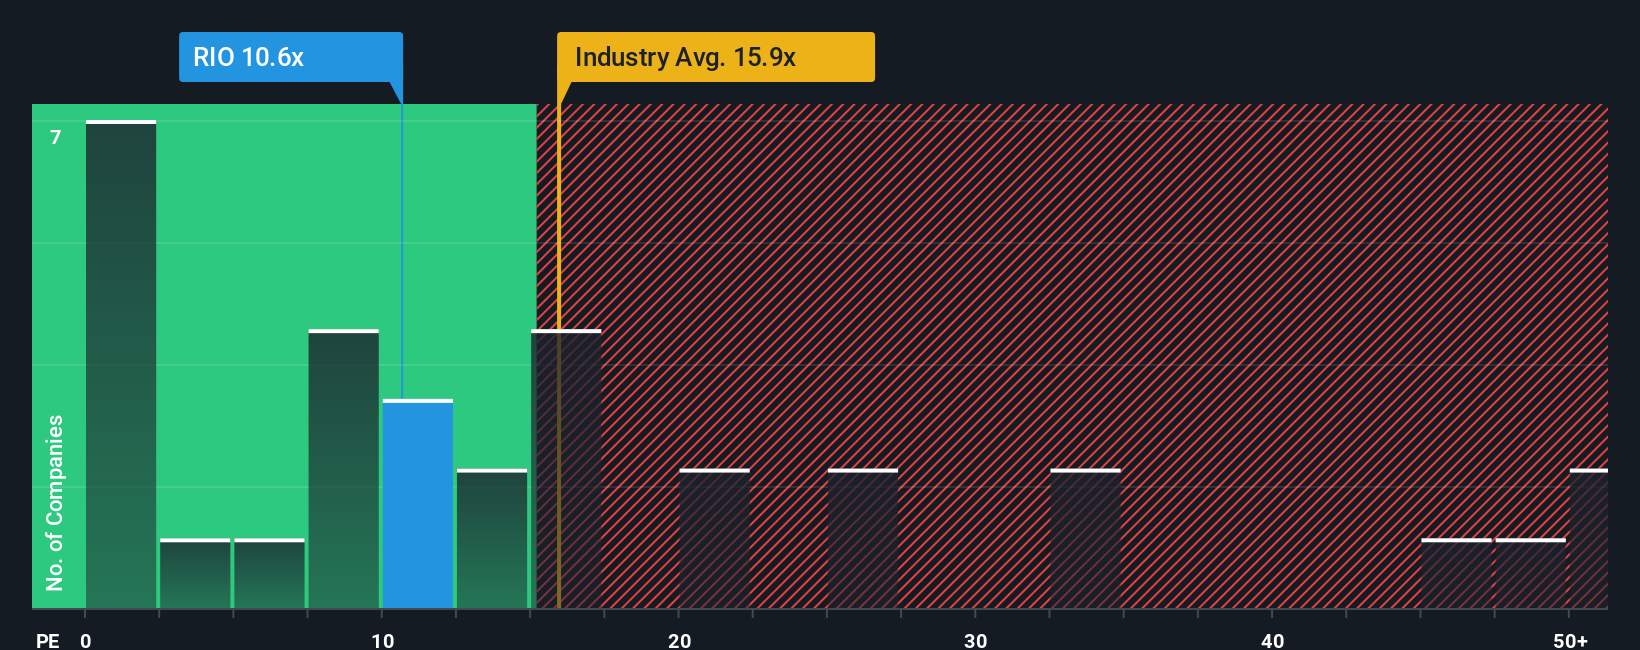
Rio Tinto Group currently trades on a P/E of 13.17x. That sits below the Metals and Mining industry average of 22.57x and well below the peer group average of 50.73x. Simply Wall St’s Fair Ratio for Rio Tinto Group is 29.05x. This is the P/E level the model suggests based on factors such as earnings growth, margins, industry, market cap and risk profile.
This Fair Ratio is more tailored than a simple peer or industry comparison because it adjusts for company specific characteristics rather than assuming all miners deserve the same multiple. Since the current P/E of 13.17x is materially below the Fair Ratio of 29.05x, the shares screen as undervalued on this measure.
Result: UNDERVALUED
P/E ratios tell one story, but what if the real opportunity lies elsewhere? Discover 1446 companies where insiders are betting big on explosive growth.
Upgrade Your Decision Making: Choose your Rio Tinto Group Narrative
Earlier we mentioned that there is an even better way to understand valuation, so let us introduce you to Narratives, which are simply your story about Rio Tinto Group turned into a set of assumptions about future revenue, earnings, margins and a fair value that you can compare directly with today’s price.
On Simply Wall St’s Community page, Narratives let you connect what you believe about Rio Tinto Group’s projects in areas like copper and lithium, its risks around geopolitics and execution, and its earnings outlook, to a numbers based forecast that rolls up into a fair value per share.
Because Narratives on the platform are refreshed when new information such as news, analyst revisions or earnings arrives, you can see how your fair value view stacks up against the current price and decide whether that gap looks wide enough for you to consider buying, holding or selling.
For example, some Rio Tinto Group Narratives on the platform anchor around a fair value close to £57.09 per share, while others lean more cautiously toward levels closer to £41.00. This shows how two investors can look at the same company, weigh the same copper, lithium and iron ore projects, and still arrive at very different but clearly structured views on what the shares are worth.
Do you think there's more to the story for Rio Tinto Group? Head over to our Community to see what others are saying!
This article by Simply Wall St is general in nature. We provide commentary based on historical data and analyst forecasts only using an unbiased methodology and our articles are not intended to be financial advice. It does not constitute a recommendation to buy or sell any stock, and does not take account of your objectives, or your financial situation. We aim to bring you long-term focused analysis driven by fundamental data. Note that our analysis may not factor in the latest price-sensitive company announcements or qualitative material. Simply Wall St has no position in any stocks mentioned.
Have feedback on this article? Concerned about the content? Get in touch with us directly. Alternatively, email editorial-team@simplywallst.com