
- PREMIUM
- LIVE QUOTES
- INSTITUTIONS
 Index Options
 State Street
 CME Group
 Nasdaq
 Cboe
Cboe TradingView
 Wall Street Journal
Is Cleveland Cliffs (CLF) Attractive After Recent Share Price Pullback And DCF Valuation Gap
- If you are wondering whether Cleveland-Cliffs at around US$12.04 is a bargain or a value trap, you are in the right place to size up what the current price actually reflects.
- The stock has had a mixed run, with a 9.3% decline over the last 7 days and a 2.7% decline over 30 days, yet it still shows a 23.5% return over 1 year and longer term 3 year and 5 year returns of 37.4% and 32.3% declines.
- Recent attention on Cleveland-Cliffs has centered on its position in the US steel and mining industry and how investors are reacting to sector wide sentiment and company specific announcements. These have added context to the shorter term pullbacks and the stronger 1 year return.
- Cleveland-Cliffs currently scores 5 out of 6 on our valuation checks, which suggests the stock screens as undervalued on most of the measures we apply. In the next sections we will walk through those approaches and finish with a broader way to think about valuation that goes beyond the numbers alone.
Find out why Cleveland-Cliffs's 23.5% return over the last year is lagging behind its peers.
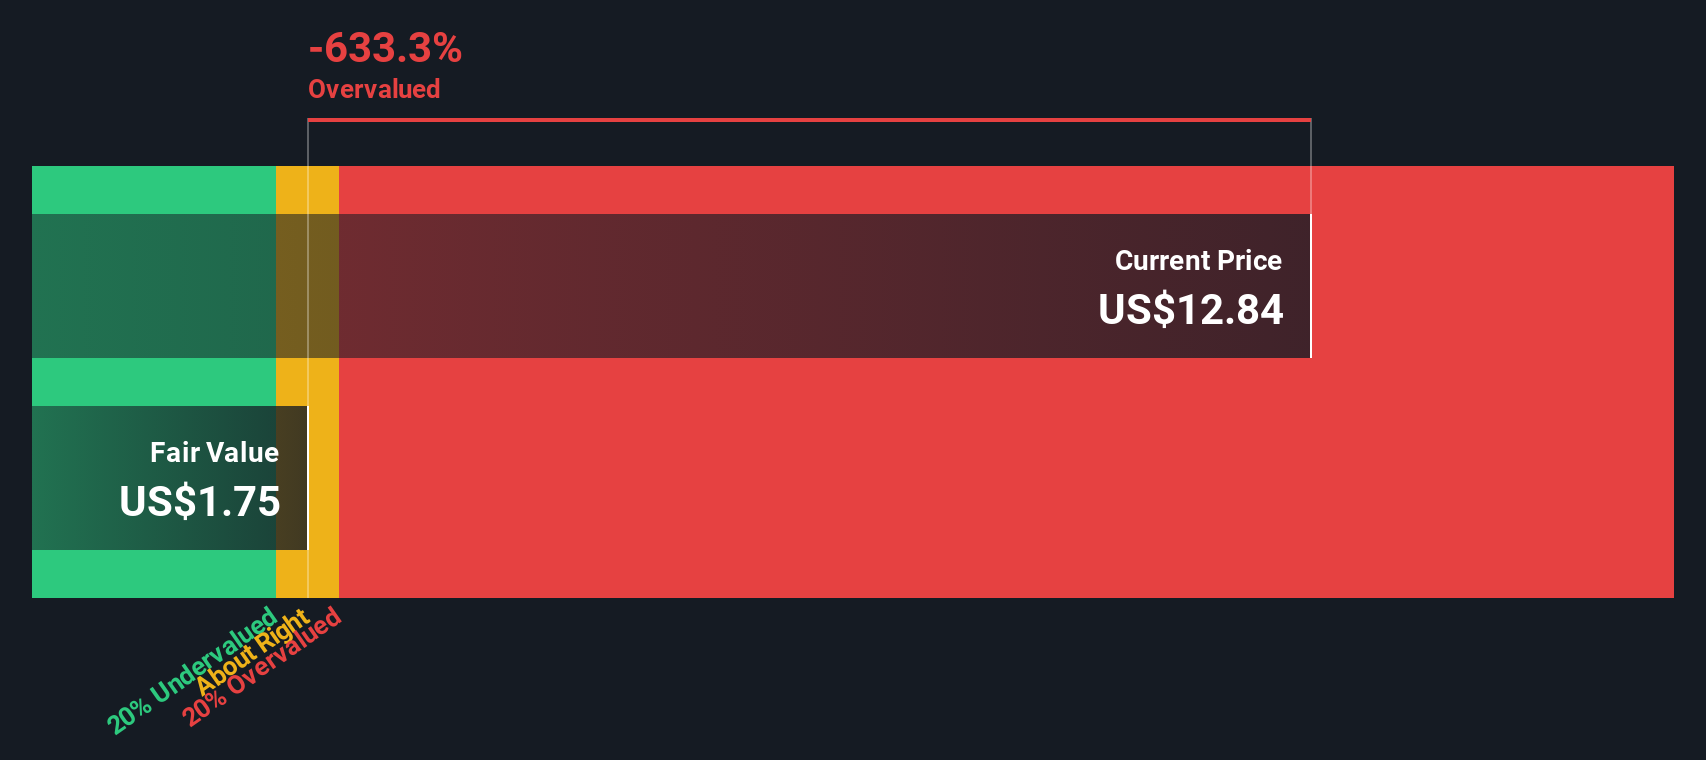
Approach 1: Cleveland-Cliffs Discounted Cash Flow (DCF) Analysis
A Discounted Cash Flow, or DCF, model takes estimates of the cash Cleveland-Cliffs might generate in the future and discounts those amounts back to what they could be worth to shareholders today.
On the latest figures, Cleveland-Cliffs reported last twelve month free cash flow of a loss of $1.53b. Analysts then provide specific free cash flow estimates for the next few years, and Simply Wall St extends those out to a 10 year path using a 2 Stage Free Cash Flow to Equity model.
Within that path, free cash flow is projected at $372.67m in 2026 and $577.50m in 2027, with further extrapolated projections rising to $1.54b by 2035. All of these cash flows are discounted back to today in dollars to estimate what the stream could be worth in present value terms.
Putting this together, the model arrives at an intrinsic value of about $21.15 per share. Compared with the current share price of roughly $12.04, the DCF suggests Cleveland-Cliffs trades at a 43.1% discount on this method alone.
Result: UNDERVALUED
Our Discounted Cash Flow (DCF) analysis suggests Cleveland-Cliffs is undervalued by 43.1%. Track this in your watchlist or portfolio, or discover 883 more undervalued stocks based on cash flows.
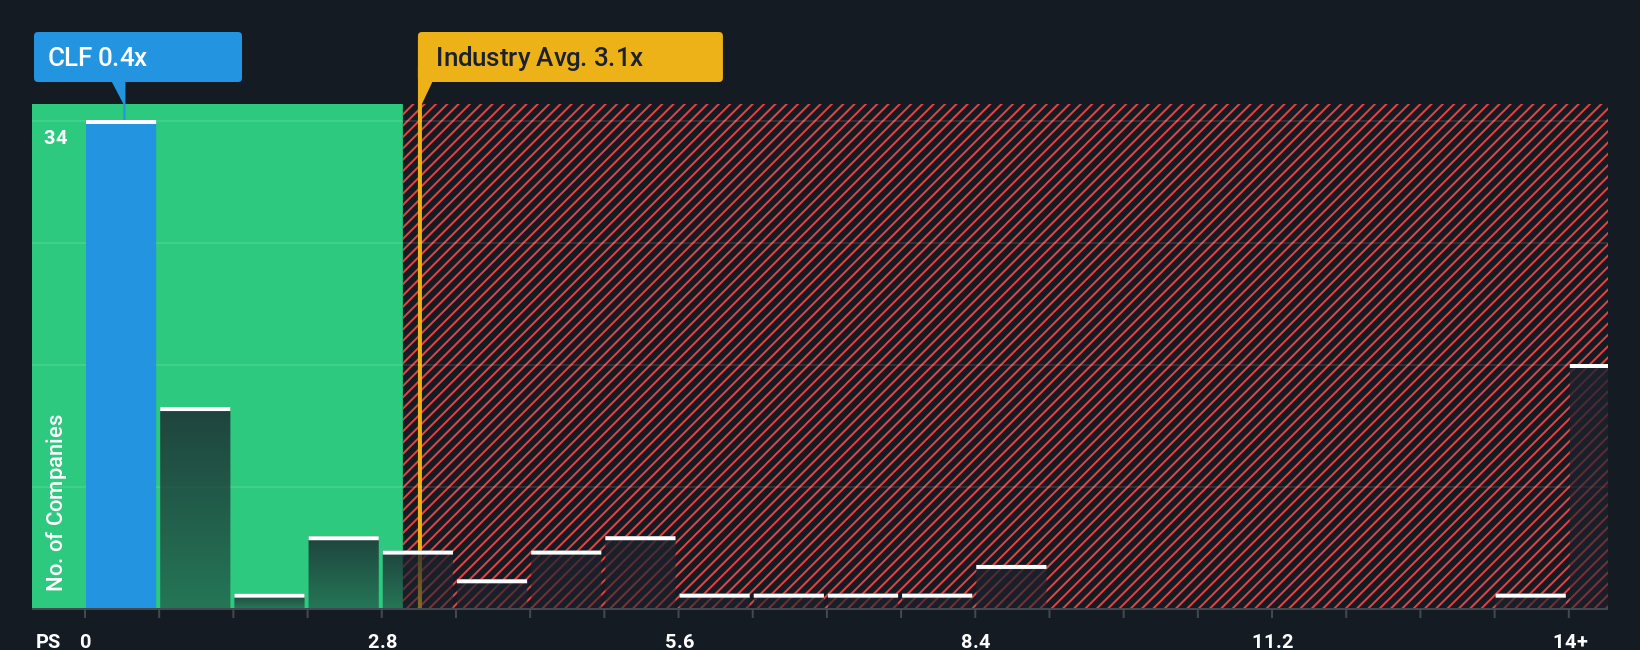
Approach 2: Cleveland-Cliffs Price vs Sales
For companies where earnings can swing around, P/S can be a useful way to look at valuation because sales are often more stable than profits and less affected by short term cost or accounting movements.
In general, higher expected growth and lower perceived risk can justify a higher P/S ratio, while lower growth and higher risk tend to point to a lower P/S as a reasonable range.
Cleveland-Cliffs is currently trading at a P/S ratio of 0.42x. That sits well below the Metals and Mining industry average of 2.48x and the peer average of 1.66x, which on a simple comparison suggests the market is pricing its sales at a discount to many competitors.
Simply Wall St’s Fair Ratio for Cleveland-Cliffs, at 0.61x, reflects a P/S level that aligns with factors such as its earnings profile, industry, profit margins, market cap and risk characteristics. This Fair Ratio is designed to be more tailored than a broad peer or industry comparison because it adjusts for the company’s own growth and risk drivers rather than treating all miners as identical.
Comparing the current 0.42x P/S with the 0.61x Fair Ratio points to Cleveland-Cliffs screening as undervalued on this measure.
Result: UNDERVALUED
P/S ratios tell one story, but what if the real opportunity lies elsewhere? Discover 1446 companies where insiders are betting big on explosive growth.
Upgrade Your Decision Making: Choose your Cleveland-Cliffs Narrative
Earlier we mentioned that there is an even better way to understand valuation, so let us introduce you to Narratives. These are simple stories you create about Cleveland-Cliffs that link your view of its business and industry, your assumptions about future revenue, earnings and margins, and the fair value you think those numbers support. They sit within an easy tool on Simply Wall St’s Community page that helps you compare that Fair Value to today’s Price, updates automatically when new news or earnings arrive, and even lets you see how one investor focused on strong domestic demand, tariff protection and cost discipline might arrive at a higher fair value than someone who is more cautious about reliance on tariffs, blast furnace technology and automotive exposure, who in turn might anchor closer to the lower end of analyst targets such as US$5.00 instead of the higher US$14.00 figure.
Do you think there's more to the story for Cleveland-Cliffs? Head over to our Community to see what others are saying!

This article by Simply Wall St is general in nature. We provide commentary based on historical data and analyst forecasts only using an unbiased methodology and our articles are not intended to be financial advice. It does not constitute a recommendation to buy or sell any stock, and does not take account of your objectives, or your financial situation. We aim to bring you long-term focused analysis driven by fundamental data. Note that our analysis may not factor in the latest price-sensitive company announcements or qualitative material. Simply Wall St has no position in any stocks mentioned.
Have feedback on this article? Concerned about the content? Get in touch with us directly. Alternatively, email editorial-team@simplywallst.com