
Is Spotify Technology (SPOT) Pricing Look Attractive After Strong Multi Year Share Gains
- If you have been wondering whether Spotify Technology is still fairly priced or starting to look interesting, you are in the right place to size up what the current share price might be giving you.
- The stock recently closed at US$569.62, with a 1.9% decline over the last 7 days, a 0.5% decline over 30 days, a 0.9% decline year to date, and an 18.7% gain over the last year, alongside a very large return over 3 years and a 64.1% return over 5 years.
- Recent attention on Spotify has been shaped by ongoing debates about music streaming economics, artist payouts, and the role of podcasts and new formats in its platform. These themes have kept investors focused on how the business model, content mix, and user engagement might affect what they are willing to pay for the stock.
- On our checks, Spotify scores 4 out of 6 on valuation. You can see that score in more detail here. This sets up a closer look at how different models assess the current price and hints at an even richer way to think about valuation that we will come back to at the end.
Approach 1: Spotify Technology Discounted Cash Flow (DCF) Analysis
A Discounted Cash Flow, or DCF, model estimates what a business might be worth today by projecting its future cash flows and then discounting those back to a present value. It is essentially asking what future cash the company could generate for shareholders in today’s money.
For Spotify Technology, the model used is a 2 Stage Free Cash Flow to Equity approach. The latest twelve month free cash flow is reported at €2.93b. Analyst based projections and extrapolations suggest free cash flow reaching €7.58b in 2030, with a full set of annual estimates and extensions running from 2026 through 2035.
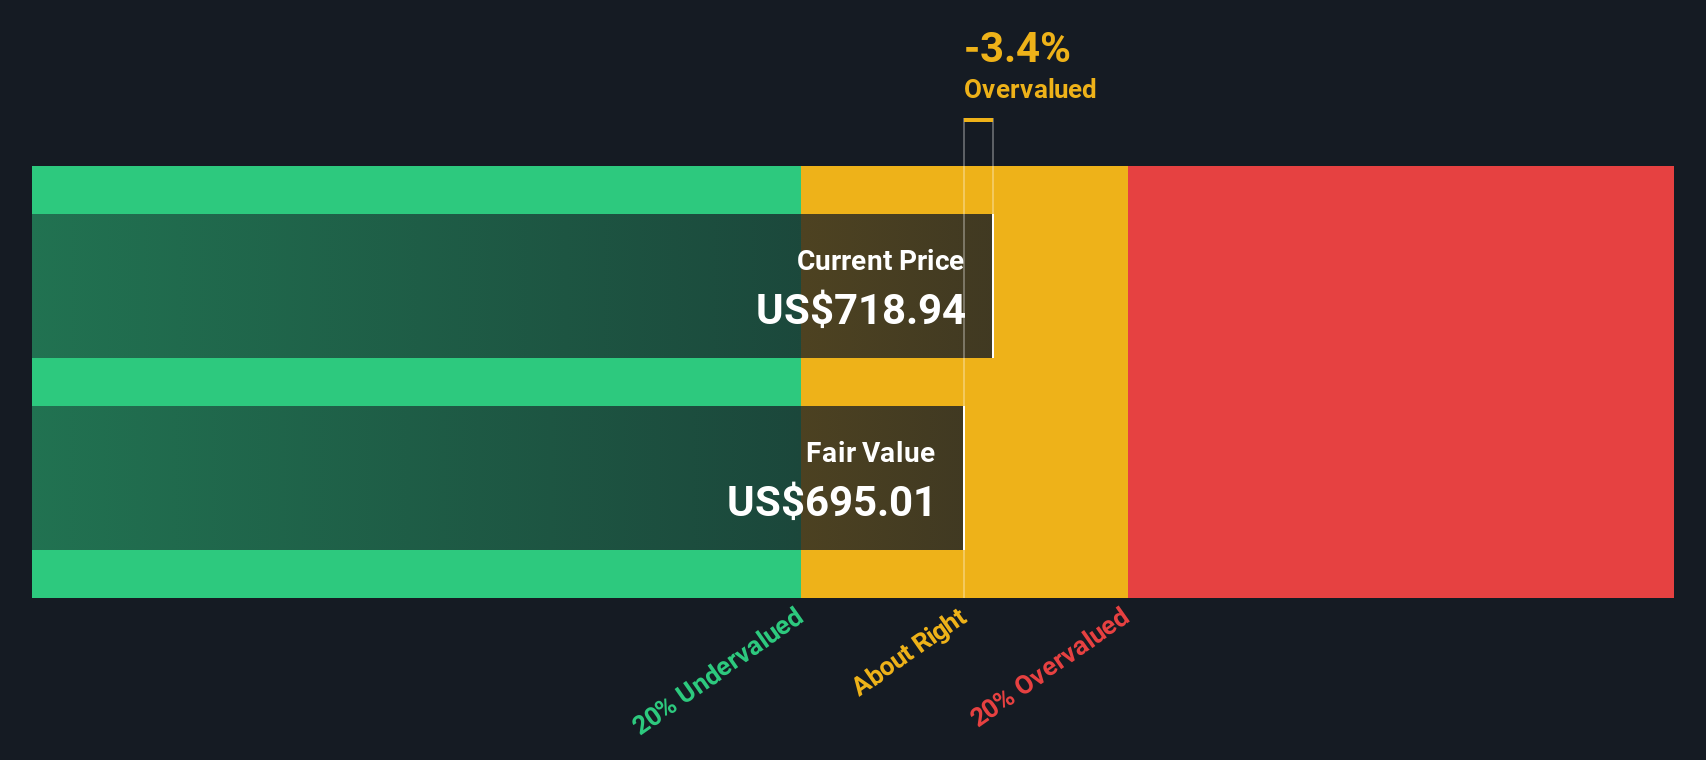
On this basis, the DCF model arrives at an estimated intrinsic value of €812.93 per share. Compared with the recent share price of US$569.62, this implies a 29.9% discount. According to these inputs and assumptions, this points to the shares trading below the model’s estimate of value.
Result: UNDERVALUED
Our Discounted Cash Flow (DCF) analysis suggests Spotify Technology is undervalued by 29.9%. Track this in your watchlist or portfolio, or discover 882 more undervalued stocks based on cash flows.
Approach 2: Spotify Technology Price vs Earnings
For a profitable company like Spotify Technology, the P/E ratio is a useful way to think about what you are paying for each unit of current earnings. Investors usually accept a higher P/E when they see stronger growth potential or lower perceived risk, and prefer a lower P/E when growth looks more modest or risks feel higher.
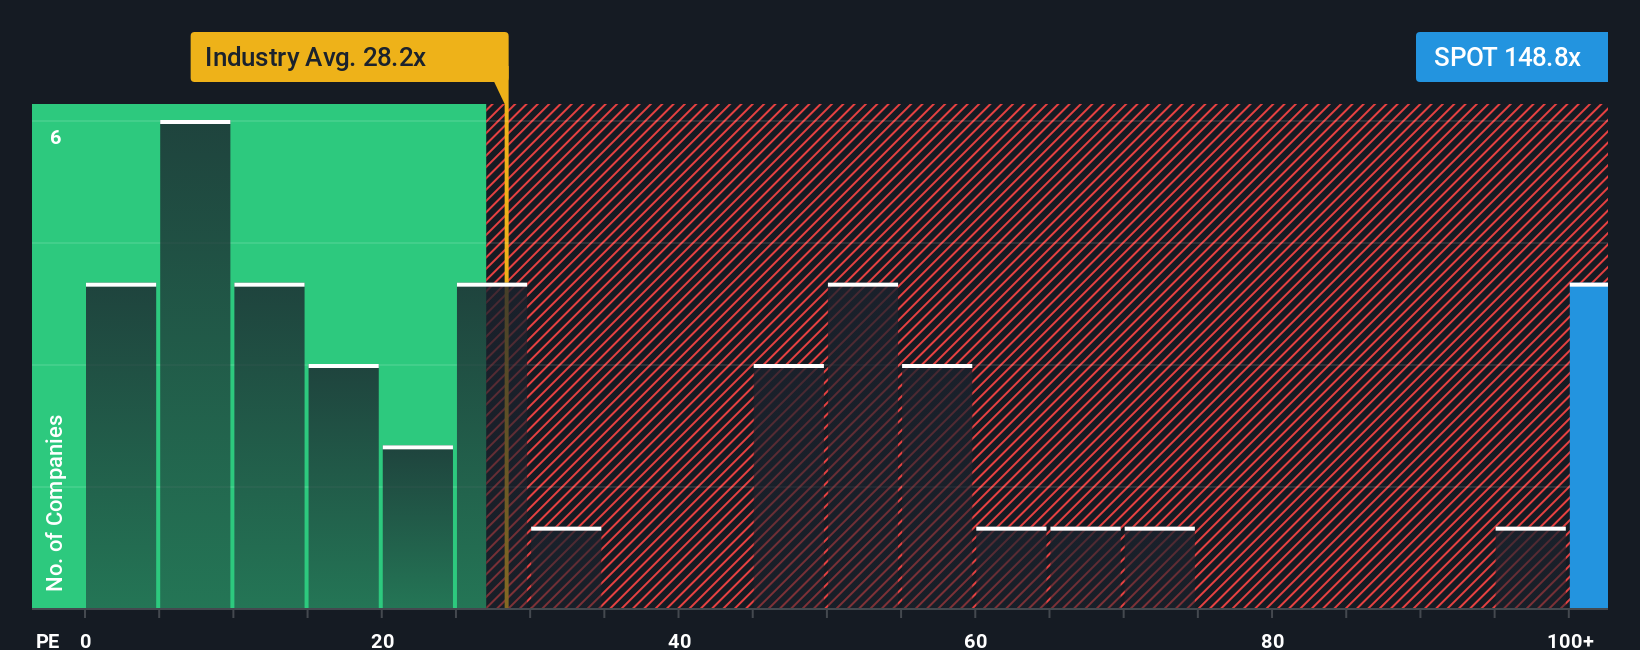
Spotify currently trades on a P/E of 71.53x. That sits well above the Entertainment industry average P/E of 17.68x and slightly below the peer group average of 76.15x. This indicates the market is placing Spotify toward the higher end of the sector’s earnings multiples.
Simply Wall St’s Fair Ratio for Spotify is 35.28x. This is a proprietary estimate of what a more tailored P/E might look like after accounting for factors such as earnings growth profile, risks, profit margins, industry, and market cap. Because it blends these company specific traits rather than relying solely on broad peer or industry comparisons, it can give a more focused read on whether the current multiple looks stretched or conservative. Compared with the actual P/E of 71.53x, the Fair Ratio points to Spotify trading on a richer multiple than this framework would suggest.
Result: OVERVALUED
P/E ratios tell one story, but what if the real opportunity lies elsewhere? Discover 1446 companies where insiders are betting big on explosive growth.
Upgrade Your Decision Making: Choose your Spotify Technology Narrative
Earlier we mentioned that there is an even better way to understand valuation, so let us introduce you to Narratives, which are simply your written story about a company, linked directly to your own forecasts for revenue, earnings and margins, and then through to the fair value you think is reasonable.
On Simply Wall St’s Community page, Narratives are an accessible tool used by millions of investors, helping you connect what you believe about a business like Spotify Technology to explicit numbers, then compare your Fair Value to the current price to decide whether the gap looks wide enough to consider buying, trimming or just watching.
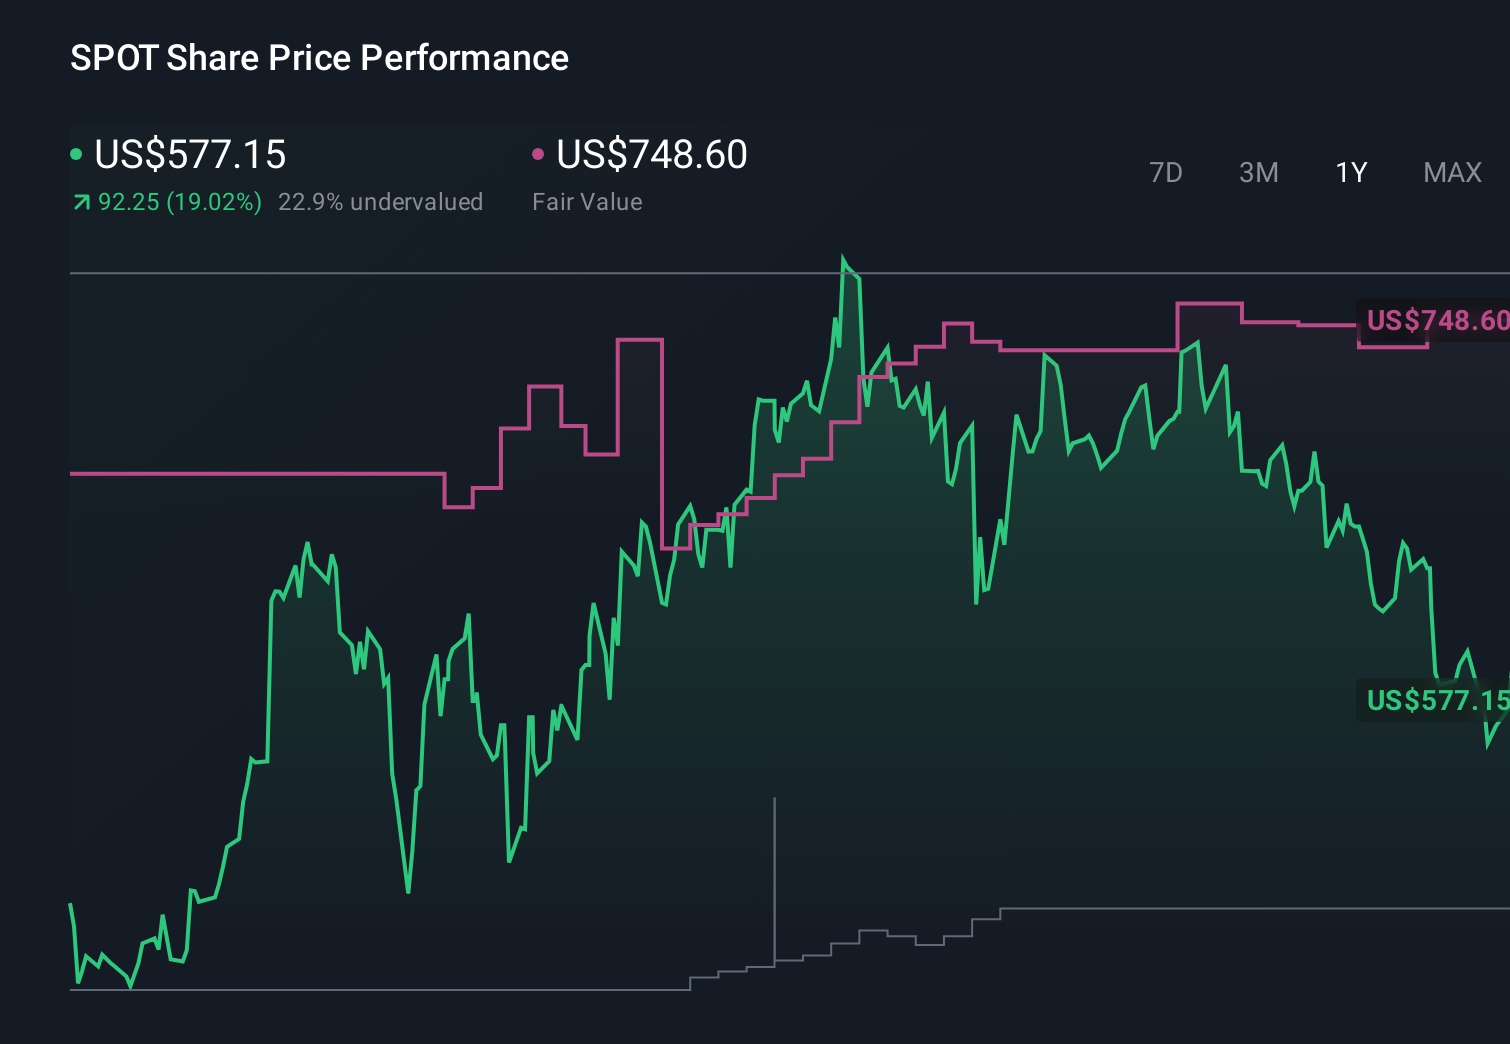
Because Narratives update as new information such as earnings, product changes or analyst revisions are added, your fair value for Spotify can shift automatically, whether you lean closer to a higher fair value, like around US$748.60, or a lower view closer to US$485.37. This shows how two investors using the same stock can arrive at very different but clearly explained positions.
Do you think there's more to the story for Spotify Technology? Head over to our Community to see what others are saying!
This article by Simply Wall St is general in nature. We provide commentary based on historical data and analyst forecasts only using an unbiased methodology and our articles are not intended to be financial advice. It does not constitute a recommendation to buy or sell any stock, and does not take account of your objectives, or your financial situation. We aim to bring you long-term focused analysis driven by fundamental data. Note that our analysis may not factor in the latest price-sensitive company announcements or qualitative material. Simply Wall St has no position in any stocks mentioned.
Have feedback on this article? Concerned about the content? Get in touch with us directly. Alternatively, email editorial-team@simplywallst.com