
- PREMIUM
- LIVE QUOTES
- INSTITUTIONS
 Index Options
 State Street
 CME Group
 Nasdaq
 Cboe
Cboe TradingView
 Wall Street Journal
Assessing Fabrinet (FN) Valuation As Minervini Trend Template Momentum Draws Fresh Investor Interest
Why Fabrinet Is Drawing Fresh Momentum Interest
Recent technical analysis has pushed Fabrinet (FN) into the spotlight, as the stock is flagged for fitting the Minervini Trend Template, with accelerating earnings, sales growth, and rising analyst estimates capturing momentum focused attention.
See our latest analysis for Fabrinet.
Fabrinet’s share price has been choppy in the short term, with a 1-day share price return of a 1.81% decline and a 30-day share price return of a 4.18% decline, but the 90-day share price return of 23.09% alongside a 1-year total shareholder return of 101.46% suggests momentum has been building over time.
If Fabrinet’s recent run has you looking for more potential growth stories in tech, it could be a good moment to check out high growth tech and AI stocks as your next stop.
With Fabrinet trading around US$470.50 and sitting only about 5% below an average analyst price target near US$492.67, the key question is simple: are you looking at an overlooked opportunity, or has the market already priced in future growth?
Most Popular Narrative: 4.5% Undervalued
With Fabrinet last closing at US$470.50 against a narrative fair value of US$492.67, the story here centers on earnings power and capital returns.
The decision to accelerate capacity expansion (Building 10) due to robust customer demand and new program ramps positions Fabrinet to capture additional large-scale opportunities in AI infrastructure and next-gen telecom. This may support both sustained revenue growth and operating leverage as fixed costs are spread over higher output.
Curious what kind of revenue path and margin profile could justify that higher fair value? The narrative focuses on faster growth, richer profitability and a firm earnings multiple. The real question, which only the full narrative answers, is how ambitious those assumptions are and how much buybacks shape per share outcomes.
Result: Fair Value of $492.67 (UNDERVALUED)
Have a read of the narrative in full and understand what's behind the forecasts.
However, you also need to weigh customer concentration around names like NVIDIA and Cisco, as well as the risk that large capital projects end up creating underused capacity.
Find out about the key risks to this Fabrinet narrative.
Another Angle On Valuation
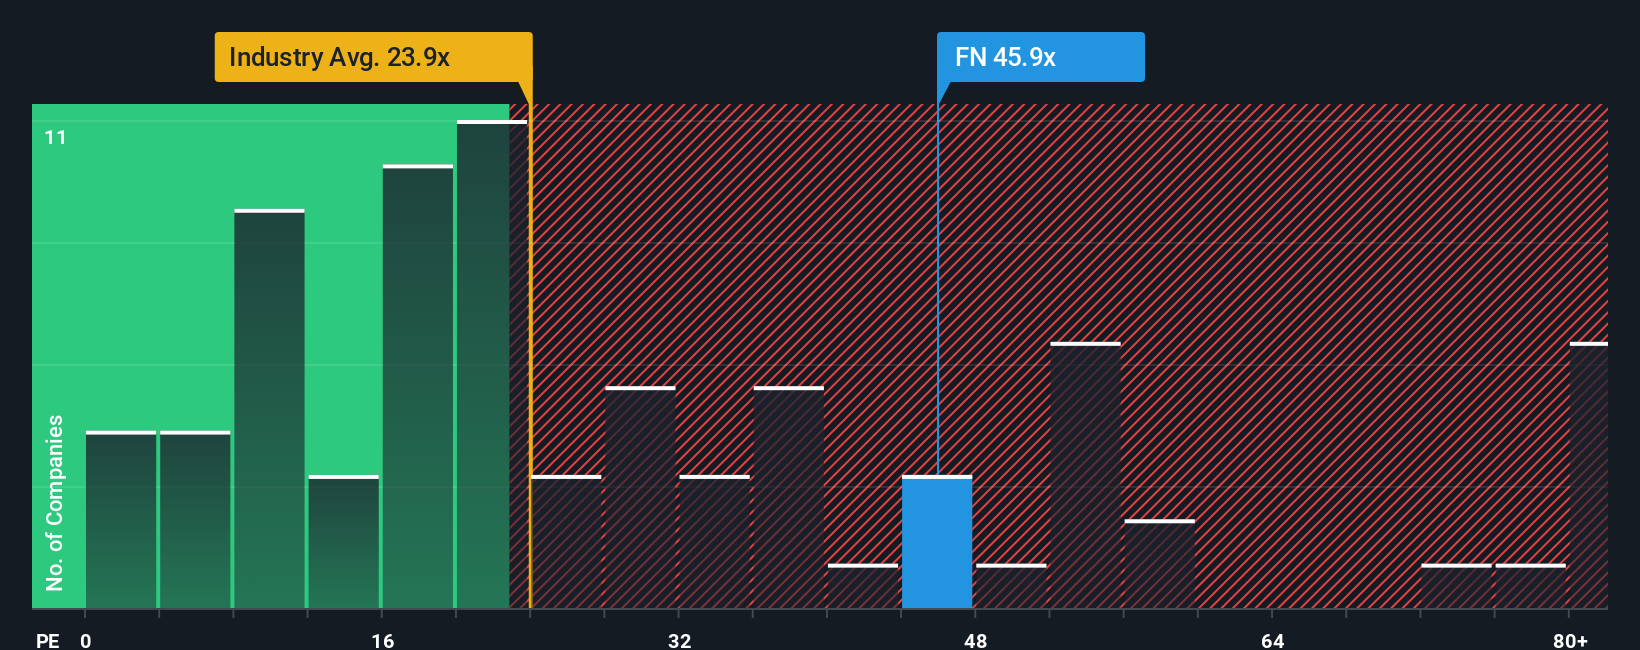
The narrative model says Fabrinet looks about 4.5% undervalued, but the earnings multiple paints a different picture. At a P/E of 48x versus an estimated fair ratio of 36.4x, and 25.7x for the US Electronic industry and 37.3x for peers, the shares screen as expensive. For you, that raises a simple question: are you comfortable paying this kind of premium for the current growth profile?
See what the numbers say about this price — find out in our valuation breakdown.
Build Your Own Fabrinet Narrative
If you are not fully on board with this story or prefer to lean on your own research, you can quickly build and stress test a custom view in just a few minutes with Do it your way.
A great starting point for your Fabrinet research is our analysis highlighting 2 key rewards and 1 important warning sign that could impact your investment decision.
Ready To Hunt For Your Next Idea?
If Fabrinet has caught your attention, do not stop there. Use this momentum to widen your watchlist and spot other opportunities before the crowd does.
- Target potential mispricings by scanning these 882 undervalued stocks based on cash flows that may offer stronger fundamentals than their current market prices suggest.
- Spot the next wave of machine learning leaders by checking out these 27 AI penny stocks shaping data driven products and infrastructure.
- Tap into early stage opportunities by reviewing these 3543 penny stocks with strong financials that still trade at lower share prices but already show solid financial underpinnings.
This article by Simply Wall St is general in nature. We provide commentary based on historical data and analyst forecasts only using an unbiased methodology and our articles are not intended to be financial advice. It does not constitute a recommendation to buy or sell any stock, and does not take account of your objectives, or your financial situation. We aim to bring you long-term focused analysis driven by fundamental data. Note that our analysis may not factor in the latest price-sensitive company announcements or qualitative material. Simply Wall St has no position in any stocks mentioned.
Have feedback on this article? Concerned about the content? Get in touch with us directly. Alternatively, email editorial-team@simplywallst.com