
- PREMIUM
- LIVE QUOTES
- INSTITUTIONS
 Index Options
 State Street
 CME Group
 Nasdaq
 Cboe
Cboe TradingView
 Wall Street Journal
American Tower (AMT) Valuation Check After Recent Share Price Weakness
American Tower after a tough stretch for the stock
American Tower (AMT) has seen its share price under pressure recently, with a 7.5% decline over the past month and an 8.6% drop over the past 3 months. This performance has prompted investors to reassess the REIT’s current setup.
See our latest analysis for American Tower.
Looking beyond the recent weakness, American Tower’s 1 year total shareholder return of 2.1% decline and 3 year total shareholder return of 17.8% decline suggest fading momentum. This comes as the latest share price sits at $169.44 with a 3.1% year to date share price return decline.
If American Tower’s recent pullback has you reassessing your watchlist, it could be a good moment to broaden your search with fast growing stocks with high insider ownership.
With American Tower trading at $169.44 and sitting at a 37.2% intrinsic discount by one estimate, the key question is whether the recent weakness leaves meaningful upside on the table or if the market already reflects its future growth potential.
Price-to-Earnings of 27x: Is it justified?
At a last close of $169.44, American Tower is trading on a P/E of 27x, which screens as good value against both peers and the broader Specialized REITs industry.
The P/E multiple compares the current share price with the company’s earnings per share, so it effectively shows how many dollars investors are paying for each dollar of earnings. For a large, global REIT that owns income producing communications infrastructure, this is a commonly watched gauge of how the market is pricing its earnings power.
Here, American Tower’s 27x P/E is described as good value versus the peer average of 40.1x and the US Specialized REITs industry average of 27.3x. It also sits below an estimated fair P/E of 34.2x, which suggests the level the market could move towards if earnings and sentiment line up with that fair ratio view.
Explore the SWS fair ratio for American Tower
Result: Price-to-Earnings of 27x (UNDERVALUED)
However, you still have to weigh risks such as a prolonged share price slump and any slowdown in revenue or net income growth that challenges the current P/E.
Find out about the key risks to this American Tower narrative.
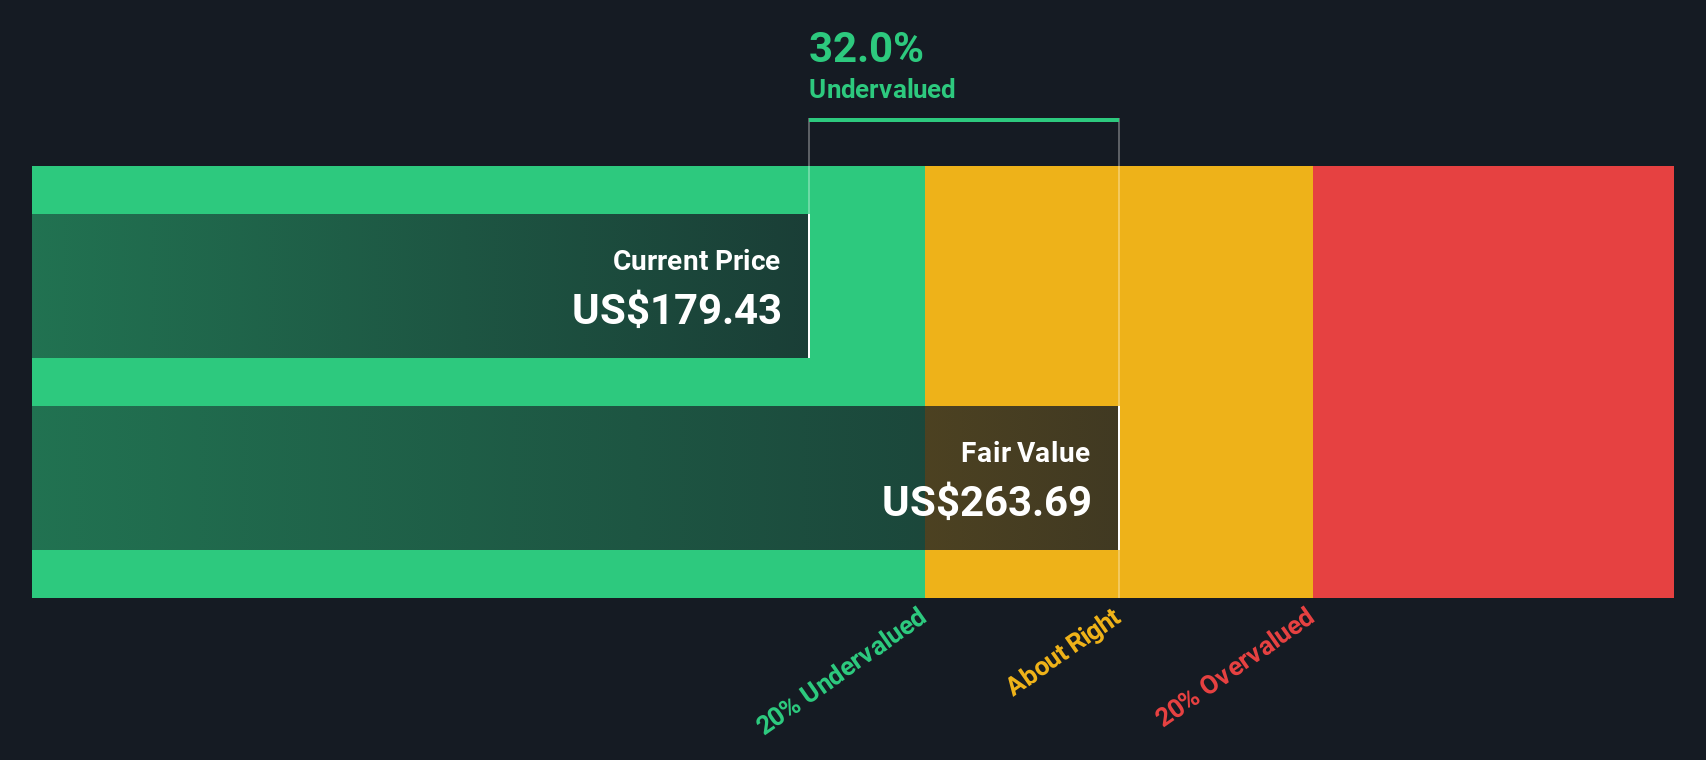
Another view using our DCF model
While the 27x P/E suggests American Tower looks inexpensive against peers, our DCF model points to a fair value of about $269.87 per share. That is a 37.2% gap to the current $169.44 price. This frames the recent weakness as a possible opportunity, but also raises the question of what risks might be keeping the discount in place.
Look into how the SWS DCF model arrives at its fair value.
Simply Wall St performs a discounted cash flow (DCF) on every stock in the world every day (check out American Tower for example). We show the entire calculation in full. You can track the result in your watchlist or portfolio and be alerted when this changes, or use our stock screener to discover 882 undervalued stocks based on their cash flows. If you save a screener we even alert you when new companies match - so you never miss a potential opportunity.
Build Your Own American Tower Narrative
If you look at the numbers and reach a different conclusion, or simply prefer to stress test the data yourself, you can build your own narrative in just a few minutes with Do it your way.
A great starting point for your American Tower research is our analysis highlighting 6 key rewards and 1 important warning sign that could impact your investment decision.
Looking for more investment ideas?
If American Tower is on your radar, do not stop there. Use this moment to widen your search and pressure test your thinking across other themes.
- Spot potential value by scanning these 882 undervalued stocks based on cash flows that the market may be pricing cautiously compared to their cash flow profiles.
- Tap into powerful growth themes by checking out these 27 AI penny stocks shaping the future of automation and data driven decision making.
- Strengthen your income focus by reviewing these 12 dividend stocks with yields > 3% that offer yields above 3% while you assess long term return potential.
This article by Simply Wall St is general in nature. We provide commentary based on historical data and analyst forecasts only using an unbiased methodology and our articles are not intended to be financial advice. It does not constitute a recommendation to buy or sell any stock, and does not take account of your objectives, or your financial situation. We aim to bring you long-term focused analysis driven by fundamental data. Note that our analysis may not factor in the latest price-sensitive company announcements or qualitative material. Simply Wall St has no position in any stocks mentioned.
Have feedback on this article? Concerned about the content? Get in touch with us directly. Alternatively, email editorial-team@simplywallst.com