
- PREMIUM
- LIVE QUOTES
- INSTITUTIONS
 Index Options
 State Street
 CME Group
 Nasdaq
 Cboe
Cboe TradingView
 Wall Street Journal
Is It Time To Reassess TowneBank (TOWN) After Its Strong Five Year Share Price Run
- If you have been watching TowneBank and wondering whether the recent price levels still make sense, this article will help you weigh up what you are really paying for each dollar of its business.
- The stock last closed at US$34.08, with returns of 2.1% over the past week, a 0.7% decline over the past month, 2.6% year to date, 6.0% over one year, 22.3% over three years and 57.9% over five years, which may have you asking whether the current price fairly reflects the underlying fundamentals.
- Recent price moves are set against a backdrop of ongoing sector wide attention on regional banks, including how they balance growth with capital strength and local lending focus. For TowneBank, news flow has often centered on its community banking role and broader market sentiment toward financials, which can influence how investors view risk and reward for the stock.
- Our valuation checks give TowneBank a score of 3 out of 6. This suggests some measures point to value while others are more mixed. Next we will walk through these methods, then close the article with a way to put all of the valuation pieces into a clearer big picture.
Find out why TowneBank's 6.0% return over the last year is lagging behind its peers.
Approach 1: TowneBank Excess Returns Analysis
The Excess Returns model looks at how much value TowneBank may create over and above the return that shareholders are assumed to require. It compares the return generated on the bank’s equity with its cost of equity, then capitalizes that “excess” into an intrinsic value per share.
For TowneBank, book value is $30.81 per share and the stable book value estimate is $34.99 per share, both based on weighted future book value estimates from 4 analysts. Stable EPS is $3.81 per share, derived from weighted future return on equity estimates from the same 4 analysts, and the average return on equity used in the model is 10.90%.
The model applies a cost of equity of $2.43 per share, implying an excess return of $1.38 per share on that equity base. When those excess returns are projected and discounted, the Excess Returns model arrives at an estimated intrinsic value of about $72.33 per share.
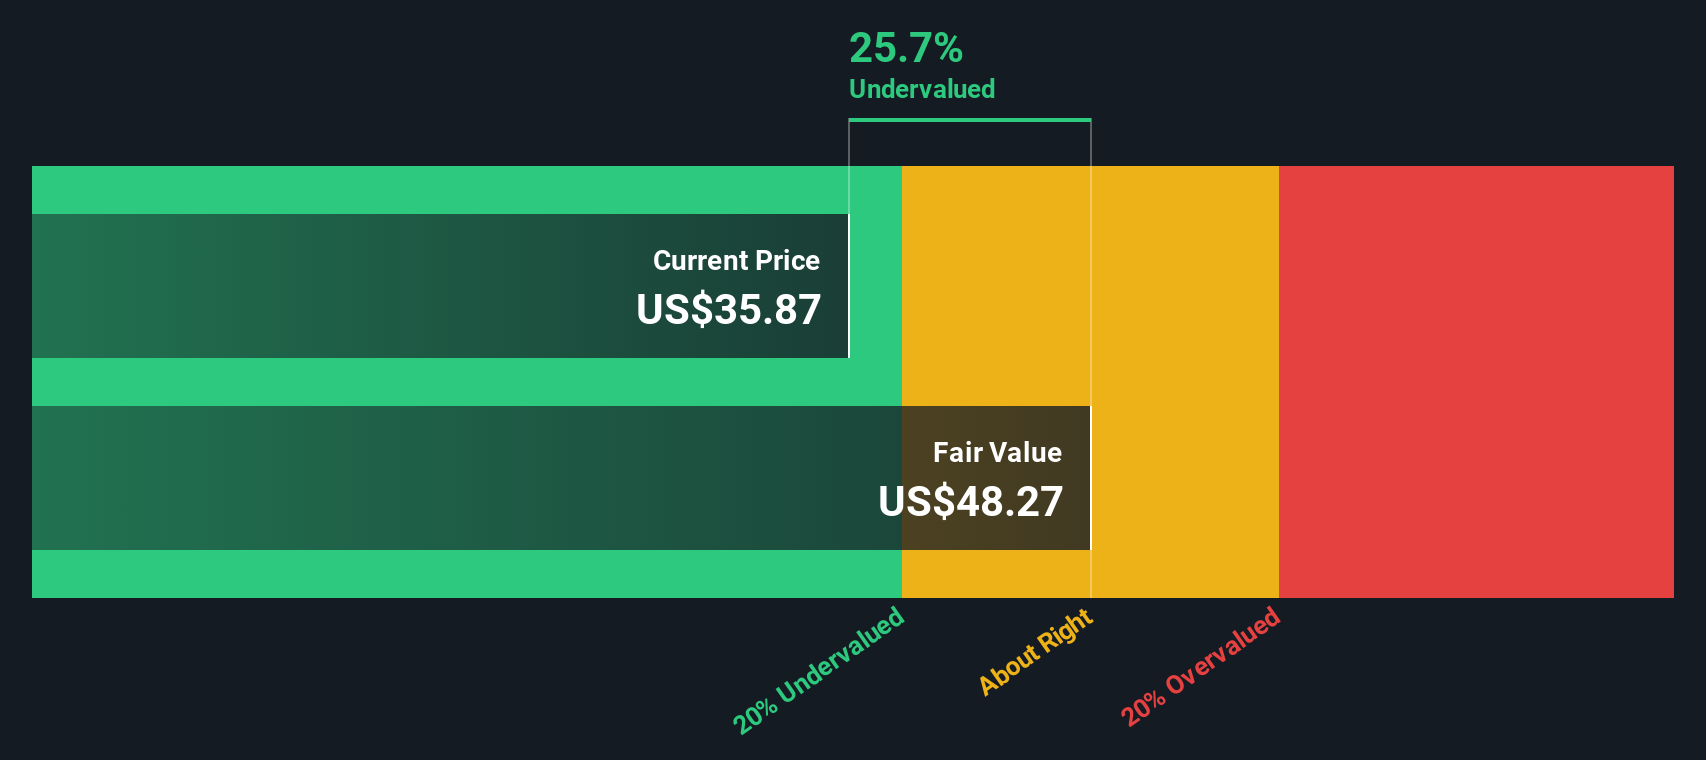
Against a recent share price of US$34.08, this implies the stock is 52.9% undervalued according to this approach.
Result: UNDERVALUED
Our Excess Returns analysis suggests TowneBank is undervalued by 52.9%. Track this in your watchlist or portfolio, or discover 879 more undervalued stocks based on cash flows.
Approach 2: TowneBank Price vs Earnings
For a profitable bank like TowneBank, the P/E ratio is a straightforward way to see what you are paying for each dollar of current earnings. It links directly to the income statement, which is where most investors focus when they think about how quickly earnings might compound over time and how dependable those earnings are.
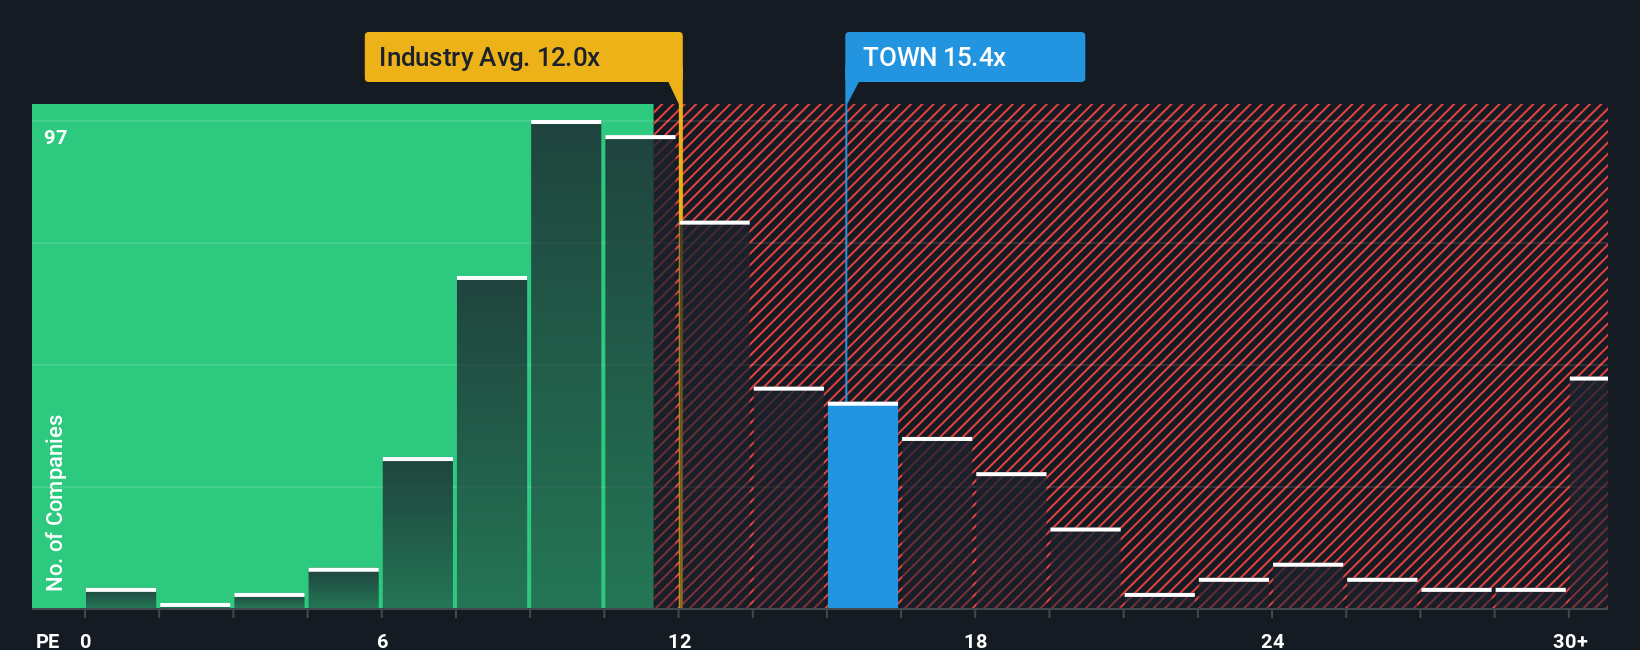
In general, higher growth expectations and lower perceived risk can justify a higher “normal” or “fair” P/E ratio, while slower expected growth or higher risk tend to support a lower one. TowneBank currently trades on a P/E of 15.63x. That sits above the Banks industry average of 11.87x and also above the peer group average of 13.05x, suggesting the market is willing to pay a higher multiple than for many regional banking peers.
Simply Wall St’s Fair Ratio for TowneBank is 18.55x. This is a proprietary estimate of what a justified P/E might be, based on factors such as earnings growth, industry, profit margins, market cap and company specific risks. Because it adjusts for these elements, the Fair Ratio can be a more tailored benchmark than a simple comparison with sector or peer averages. On this basis, TowneBank’s current P/E of 15.63x is below the 18.55x Fair Ratio, which points to the shares looking undervalued on this metric.
Result: UNDERVALUED
P/E ratios tell one story, but what if the real opportunity lies elsewhere? Discover 1443 companies where insiders are betting big on explosive growth.
Upgrade Your Decision Making: Choose your TowneBank Narrative
Earlier we mentioned that there is an even better way to understand valuation, so let us introduce you to Narratives, which are simply your story about a company, linked directly to your own fair value, revenue, earnings and margin estimates. Instead of only looking at fixed numbers like a P/E or model output, a Narrative connects what you believe about TowneBank’s business to a financial forecast, then to a fair value that you can compare with today’s share price. On Simply Wall St, Narratives sit inside the Community page, where millions of investors share these story plus forecast views in a format that is quick to read and easy to tweak. Because each Narrative compares its Fair Value to the current Price, it can help you decide whether the stock looks attractively priced or expensive based on your assumptions, and those Narratives refresh automatically as new news or earnings are released. For example, one TowneBank Narrative might assume a very conservative outlook and arrive at a low fair value, while another might use more optimistic revenue and margin assumptions and therefore reach a much higher fair value.
Do you think there's more to the story for TowneBank? Head over to our Community to see what others are saying!

This article by Simply Wall St is general in nature. We provide commentary based on historical data and analyst forecasts only using an unbiased methodology and our articles are not intended to be financial advice. It does not constitute a recommendation to buy or sell any stock, and does not take account of your objectives, or your financial situation. We aim to bring you long-term focused analysis driven by fundamental data. Note that our analysis may not factor in the latest price-sensitive company announcements or qualitative material. Simply Wall St has no position in any stocks mentioned.
Have feedback on this article? Concerned about the content? Get in touch with us directly. Alternatively, email editorial-team@simplywallst.com