
Is It Too Late To Reassess Newegg Commerce (NEGG) After Its Huge One Year Surge?
- If you are wondering whether Newegg Commerce's recent share price levels still make sense, you are not alone. The stock's valuation story has become a key question for many investors.
- The share price sits at US$49.15 after a 3.2% decline over the last 7 days, a 28.5% decline over the last 30 days and a 440.6% return over the last year, with a 67.2% return over 3 years and a 6.0% decline year to date.
- Recent coverage has focused on Newegg's role as an online electronics and PC hardware retailer, highlighting how investor interest can pick up quickly when e commerce names attract trading momentum. This context helps frame the large 1 year share price move and the sharper pullback in the shorter term.
- On our valuation checklist Newegg Commerce scores 1 out of 6, as shown in the valuation score. Next we will compare different ways of thinking about value and finish with an approach that can help you put all of these methods into a single, clearer picture.
Newegg Commerce scores just 1/6 on our valuation checks. See what other red flags we found in the full valuation breakdown.
Approach 1: Newegg Commerce Discounted Cash Flow (DCF) Analysis
A Discounted Cash Flow, or DCF, model takes estimates of a company’s future cash flows and discounts them back to today’s dollars, aiming to arrive at an estimate of what the entire business might be worth now.
For Newegg Commerce, the model used is a 2 Stage Free Cash Flow to Equity approach, based on cash flow projections in US$. The latest twelve month free cash flow is reported at about $0.57 million. Simply Wall St then applies forecast free cash flows out to 2035, with analyst style inputs for the early years and extrapolated figures further out when direct estimates are not available.
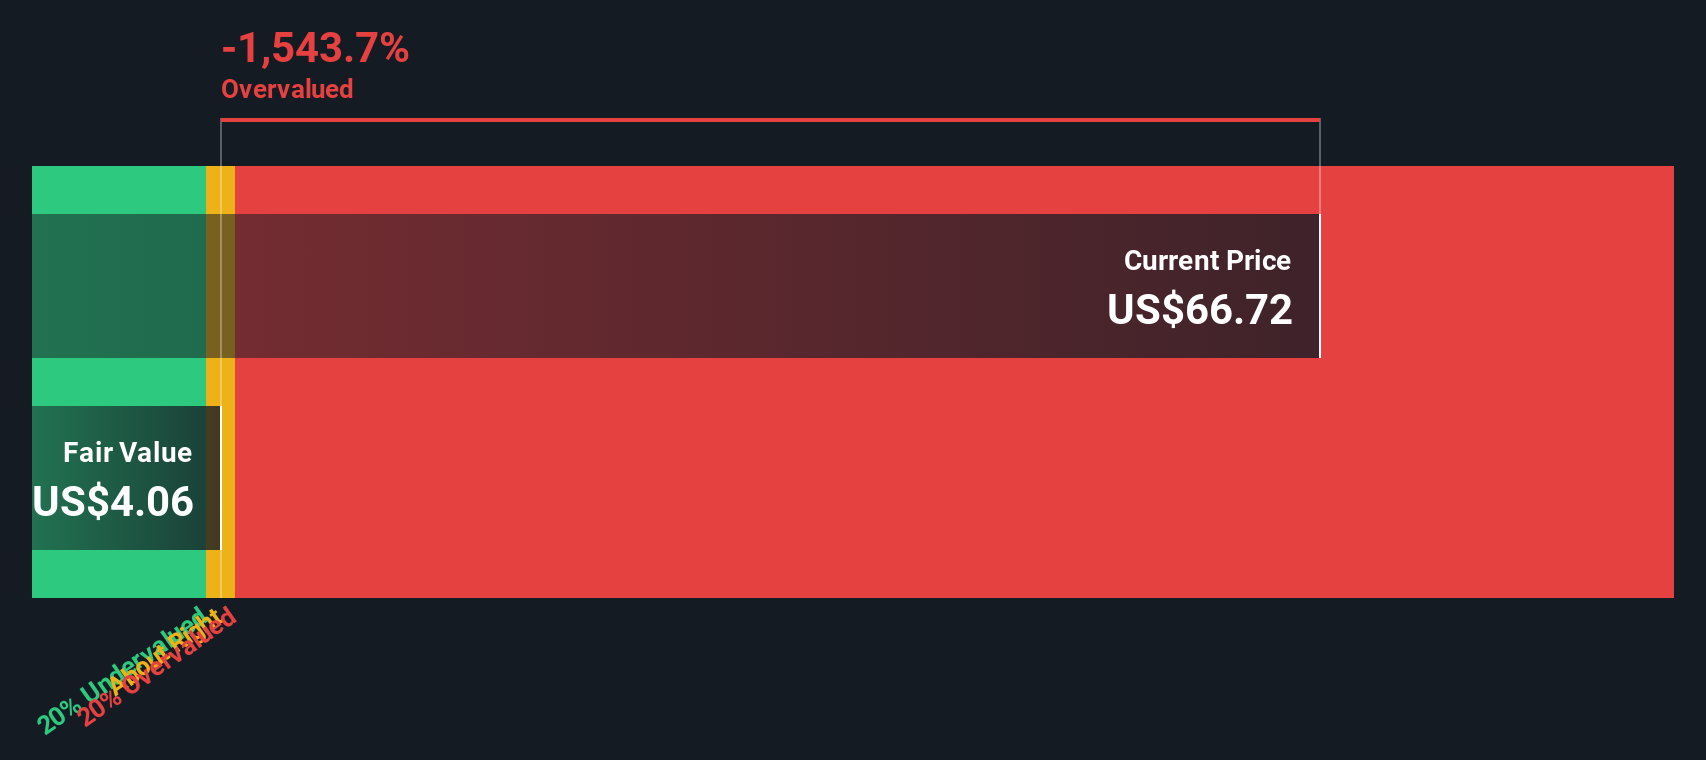
Over the next decade, the model works with projected free cash flows rising to about $6.65 million in 2035, with each year’s amount discounted back to today using the DCF framework. Adding these discounted cash flows gives an estimated intrinsic value of about $3.94 per share.
Against the current share price of US$49.15, this DCF output implies the stock is very expensive relative to those cash flow projections, with an indicated overvaluation of around 11x.
Result: OVERVALUED
Our Discounted Cash Flow (DCF) analysis suggests Newegg Commerce may be overvalued by 1147.2%. Discover 884 undervalued stocks or create your own screener to find better value opportunities.
Approach 2: Newegg Commerce Price vs Sales
For companies where earnings are limited or volatile, the P/S ratio is often a practical way to think about value because it anchors the share price to actual revenue, rather than profits that can swing around with accounting items or short term cost changes.
What counts as a reasonable P/S ratio usually reflects how quickly investors expect revenue to grow and how much risk they see in those expectations. Higher growth and lower perceived risk can support a higher multiple, while slower growth or higher uncertainty usually line up with a lower multiple.
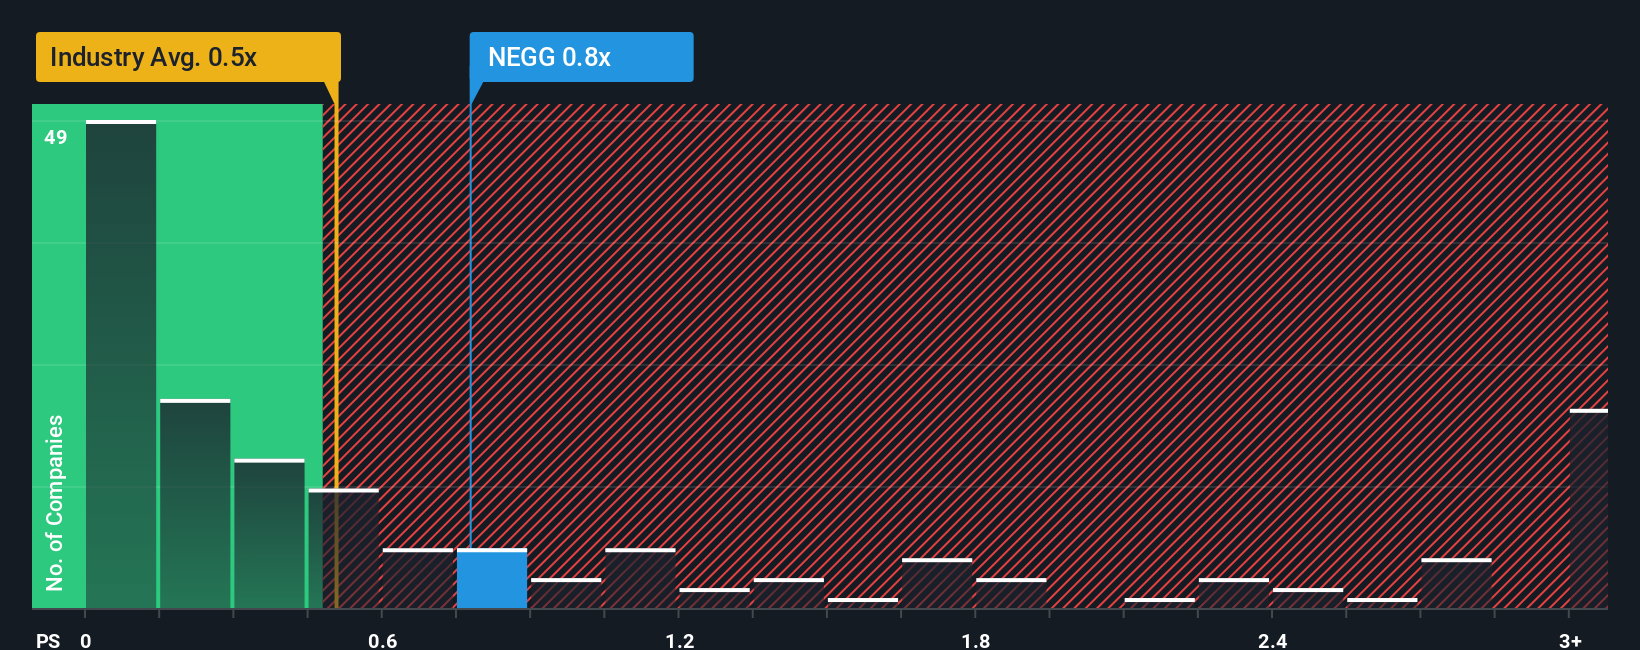
Newegg Commerce is currently trading on a P/S ratio of 0.77x. That sits above the Specialty Retail industry average of 0.49x and below the peer average of 1.10x. Simply Wall St also uses a proprietary “Fair Ratio” for the preferred multiple. This is based on factors such as earnings growth, profit margins, industry, market cap and specific risks, instead of only comparing with broad peer or industry groups.
Because the Fair Ratio figure is not available here, you should treat the comparison with industry and peers as a rough guide rather than a complete assessment of whether the current P/S looks stretched or conservative.
Result: ABOUT RIGHT
P/S ratios tell one story, but what if the real opportunity lies elsewhere? Discover 1444 companies where insiders are betting big on explosive growth.
Upgrade Your Decision Making: Choose your Newegg Commerce Narrative
Earlier we mentioned that there is an even better way to understand valuation, so let us introduce you to Narratives, which are simply your story about a company, expressed through your own fair value, and your assumptions for future revenue, earnings and margins. A Narrative links what you believe about Newegg Commerce as a business to a financial forecast, and then to a fair value that you can compare with today’s share price to help you decide whether to buy, hold or sell. On Simply Wall St, Narratives live on the Community page, where millions of investors use them as an easy and accessible tool that updates automatically when new information such as news or earnings is added to the platform. For Newegg Commerce, one investor might see a very cautious fair value based on modest revenue growth and thin margins, while another might see a much higher fair value based on stronger growth and improving profitability assumptions.
Do you think there's more to the story for Newegg Commerce? Head over to our Community to see what others are saying!

This article by Simply Wall St is general in nature. We provide commentary based on historical data and analyst forecasts only using an unbiased methodology and our articles are not intended to be financial advice. It does not constitute a recommendation to buy or sell any stock, and does not take account of your objectives, or your financial situation. We aim to bring you long-term focused analysis driven by fundamental data. Note that our analysis may not factor in the latest price-sensitive company announcements or qualitative material. Simply Wall St has no position in any stocks mentioned.
Have feedback on this article? Concerned about the content? Get in touch with us directly. Alternatively, email editorial-team@simplywallst.com