
Is Microsoft (MSFT) Still Attractive After AI Partnerships And Recent Share Price Dip
- If you are wondering whether Microsoft stock still offers value at current levels, you are not alone. Many investors are asking if the price fairly reflects what they are getting.
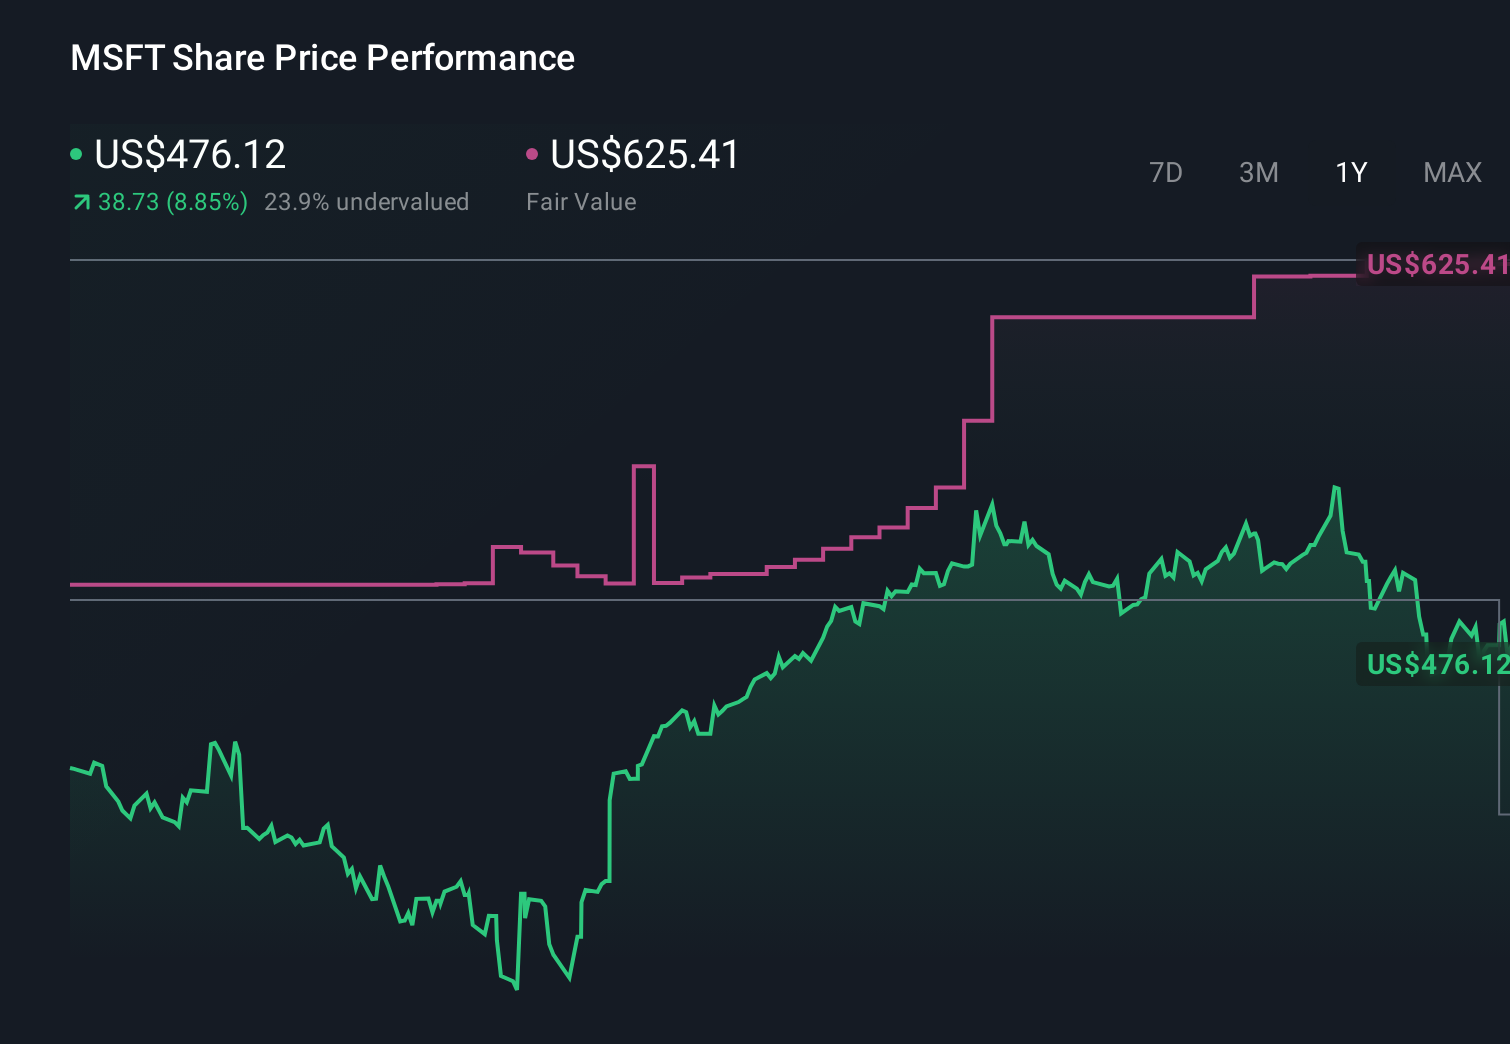
- Microsoft recently closed at US$483.47, with returns of 2.2% year to date and 14.7% over the past year, while the last 30 days show a 1.7% decline and the last week was broadly flat.
- Recent headlines have focused on Microsoft’s push in artificial intelligence partnerships and cloud services, alongside ongoing attention on its position in software and infrastructure. These themes help frame how the market is reacting to the current share price and what investors might be pricing in.
- Right now, Microsoft scores a 3/6 valuation score, meaning it screens as undervalued on three of six checks. In the next sections we will look at what different valuation approaches suggest and finish with a way of thinking about value that can tie it all together.
Approach 1: Microsoft Discounted Cash Flow (DCF) Analysis
A Discounted Cash Flow, or DCF, model estimates what a company could be worth by projecting the cash it might generate in the future and then discounting those cash flows back to today using a required rate of return.
For Microsoft, the model used is a 2 Stage Free Cash Flow to Equity approach. The latest twelve month free cash flow is about $89.4b. Analysts and extrapolated estimates feed into a path that reaches projected free cash flow of $369.8b in 2035, with interim figures such as $75.1b in 2026 and $206.2b in 2030. Simply Wall St uses analyst inputs for the earlier years and then extends that profile further out using its own assumptions.
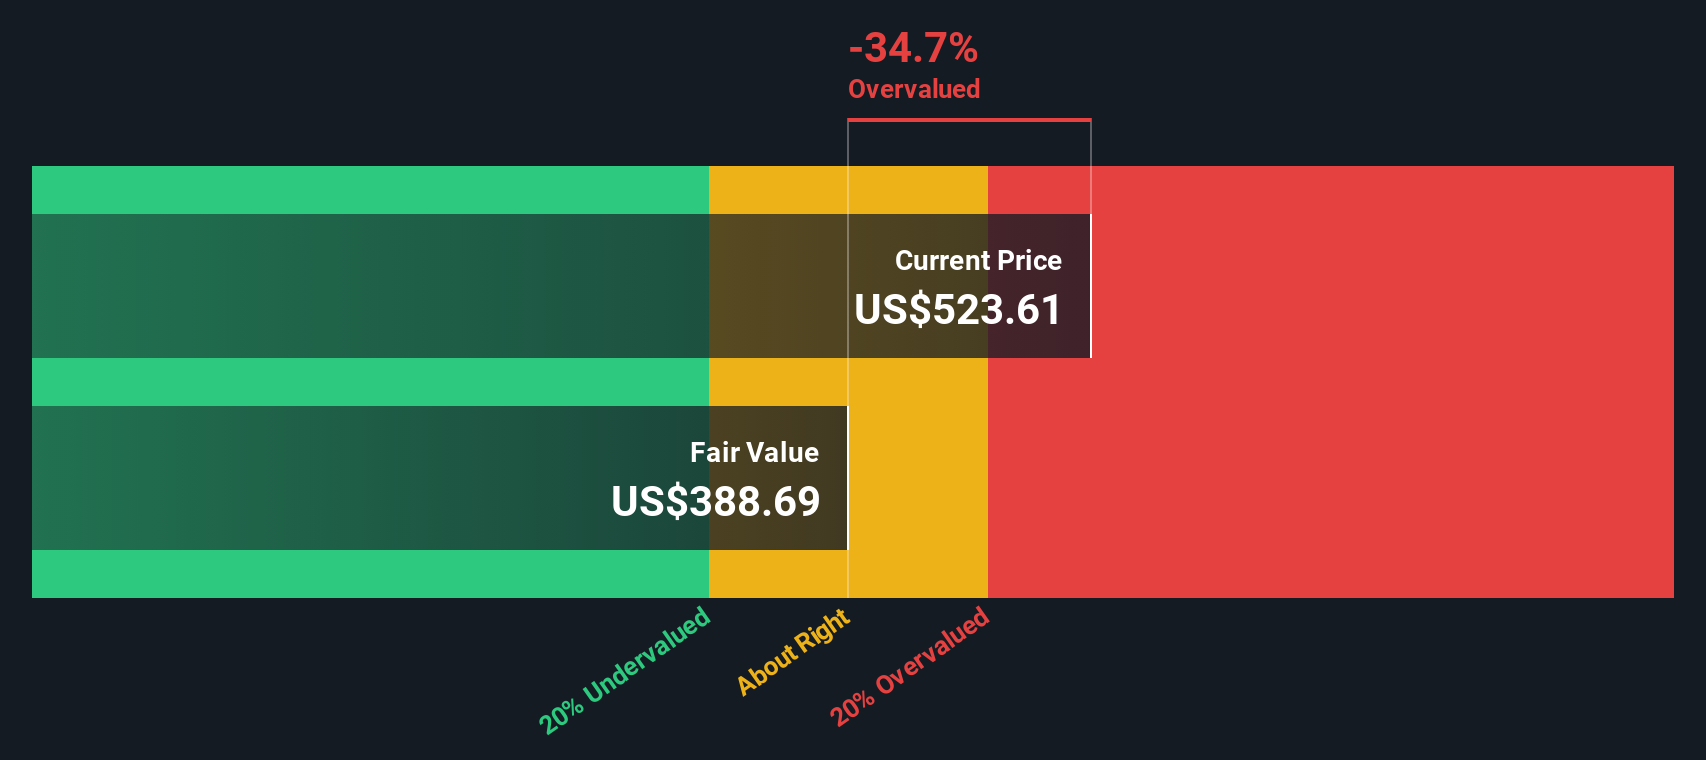
When all those future cash flows are discounted back to today, the model arrives at an intrinsic value of about $603.65 per share, compared with the recent price of $483.47. That implies the shares trade at roughly a 19.9% discount to this DCF estimate, so on this cash flow view the stock screens as undervalued.
Result: UNDERVALUED
Our Discounted Cash Flow (DCF) analysis suggests Microsoft is undervalued by 19.9%. Track this in your watchlist or portfolio, or discover 884 more undervalued stocks based on cash flows.
Approach 2: Microsoft Price vs Earnings
For a profitable company like Microsoft, the P/E ratio is a useful shorthand for what the market is willing to pay for each dollar of earnings. It ties directly to what you see on the income statement and is one of the most widely watched gauges of how optimistic or cautious investors are.
What counts as a “normal” P/E depends heavily on growth expectations and risk. Higher expected earnings growth or lower perceived risk can justify a higher P/E, while slower growth or higher uncertainty usually lines up with a lower one. So context is essential when you look at any single number.
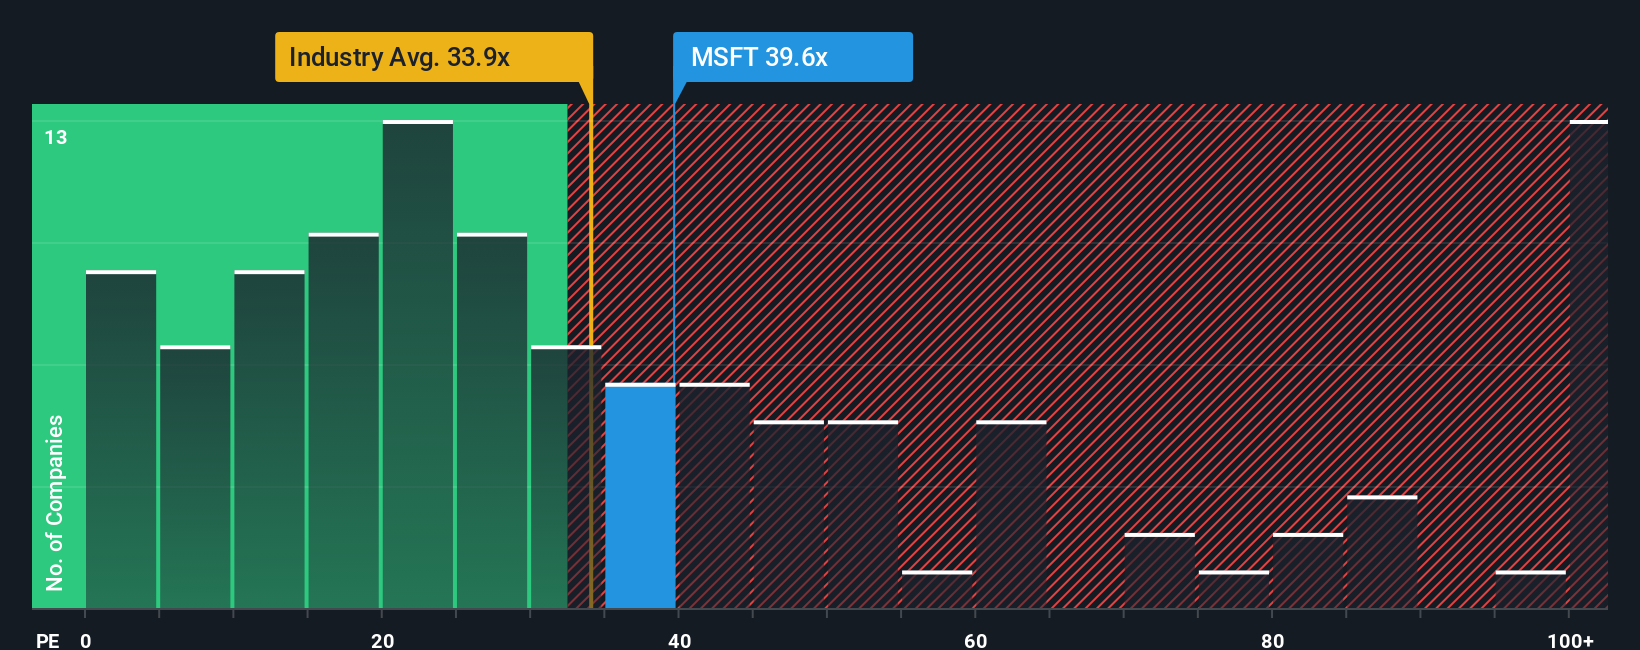
Microsoft currently trades on a P/E of 34.25x, compared with a Software industry average of about 32.70x and a peer average of 32.37x, so it sits modestly above both benchmarks. Simply Wall St also calculates a “Fair Ratio” for Microsoft of 51.36x, which is its proprietary view of what the P/E could be given factors like earnings growth, profitability, industry, market value and company specific risks.
This Fair Ratio can be more informative than a simple peer or industry comparison because it adjusts for differences in growth profiles, margins, business mix and size, rather than assuming one multiple fits all. On this basis, Microsoft’s current 34.25x P/E is below the 51.36x Fair Ratio, which indicates that the shares screen as undervalued using this metric.
Result: UNDERVALUED
P/E ratios tell one story, but what if the real opportunity lies elsewhere? Discover 1444 companies where insiders are betting big on explosive growth.
Upgrade Your Decision Making: Choose your Microsoft Narrative
Earlier we mentioned that there is an even better way to understand valuation, so let us introduce you to Narratives. These are simply your story about Microsoft tied directly to your own forecast for revenue, earnings, margins and a fair value. You can then compare that Fair Value to today’s Price, see whether your story suggests the stock looks cheap or expensive, and update that view quickly as news or earnings arrive.
For Microsoft, however, we will make it really easy for you with previews of two leading Microsoft Narratives:
On Simply Wall St there are several different narratives for the same stock, built from very different assumptions. Looking at one from each side helps you pressure test your own view before you decide whether the current price fits your expectations.
Here is how a bullish and a cautious narrative line up using the same US$483.47 share price.
Fair value in this narrative: US$622.51 per share
Implied discount to this fair value: about 22.3% below the narrative fair value
Revenue growth assumption: 15.28% a year
- Sees Microsoft’s broad AI and cloud roll out, including OpenAI and Anthropic partnerships and higher AI capacity, as supporting continued demand for Azure and AI infrastructure.
- Leans on the scale of cloud, security and subscription businesses, plus a large contracted backlog, to support earnings visibility and high margins while CapEx stays elevated.
- Accepts that heavy AI and data center spending, execution risk on big projects and dependence on large AI workloads are real risks, but views them as manageable within a long term growth story.
Fair value in this narrative: US$420.00 per share
Implied premium to this fair value: about 15.1% above the narrative fair value
Revenue growth assumption: 0.78% a year
- Questions how much value Microsoft can ultimately capture from AI, given heavy reliance on OpenAI, competition from other models and the risk that AI services become harder to price at a premium.
- Flags very high data center and AI infrastructure spending, potential pressure on software like Office 365 from AI driven efficiency and user pushback on Windows and consumer products as key concerns.
- Argues that if PC, gaming and consumer businesses weaken while AI returns fall short of expectations, the current market price could be hard to justify on this lower growth and higher risk view.
When you put these side by side, the real question is which story feels closer to how you think Microsoft’s AI, cloud, spending and user trends will play out over time, and what margin of safety you want against the price you see on screen today.
Curious how numbers become stories that shape markets? Explore Community Narratives
Do you think there's more to the story for Microsoft? Head over to our Community to see what others are saying!
This article by Simply Wall St is general in nature. We provide commentary based on historical data and analyst forecasts only using an unbiased methodology and our articles are not intended to be financial advice. It does not constitute a recommendation to buy or sell any stock, and does not take account of your objectives, or your financial situation. We aim to bring you long-term focused analysis driven by fundamental data. Note that our analysis may not factor in the latest price-sensitive company announcements or qualitative material. Simply Wall St has no position in any stocks mentioned.
Have feedback on this article? Concerned about the content? Get in touch with us directly. Alternatively, email editorial-team@simplywallst.com